Dashboard for climate data
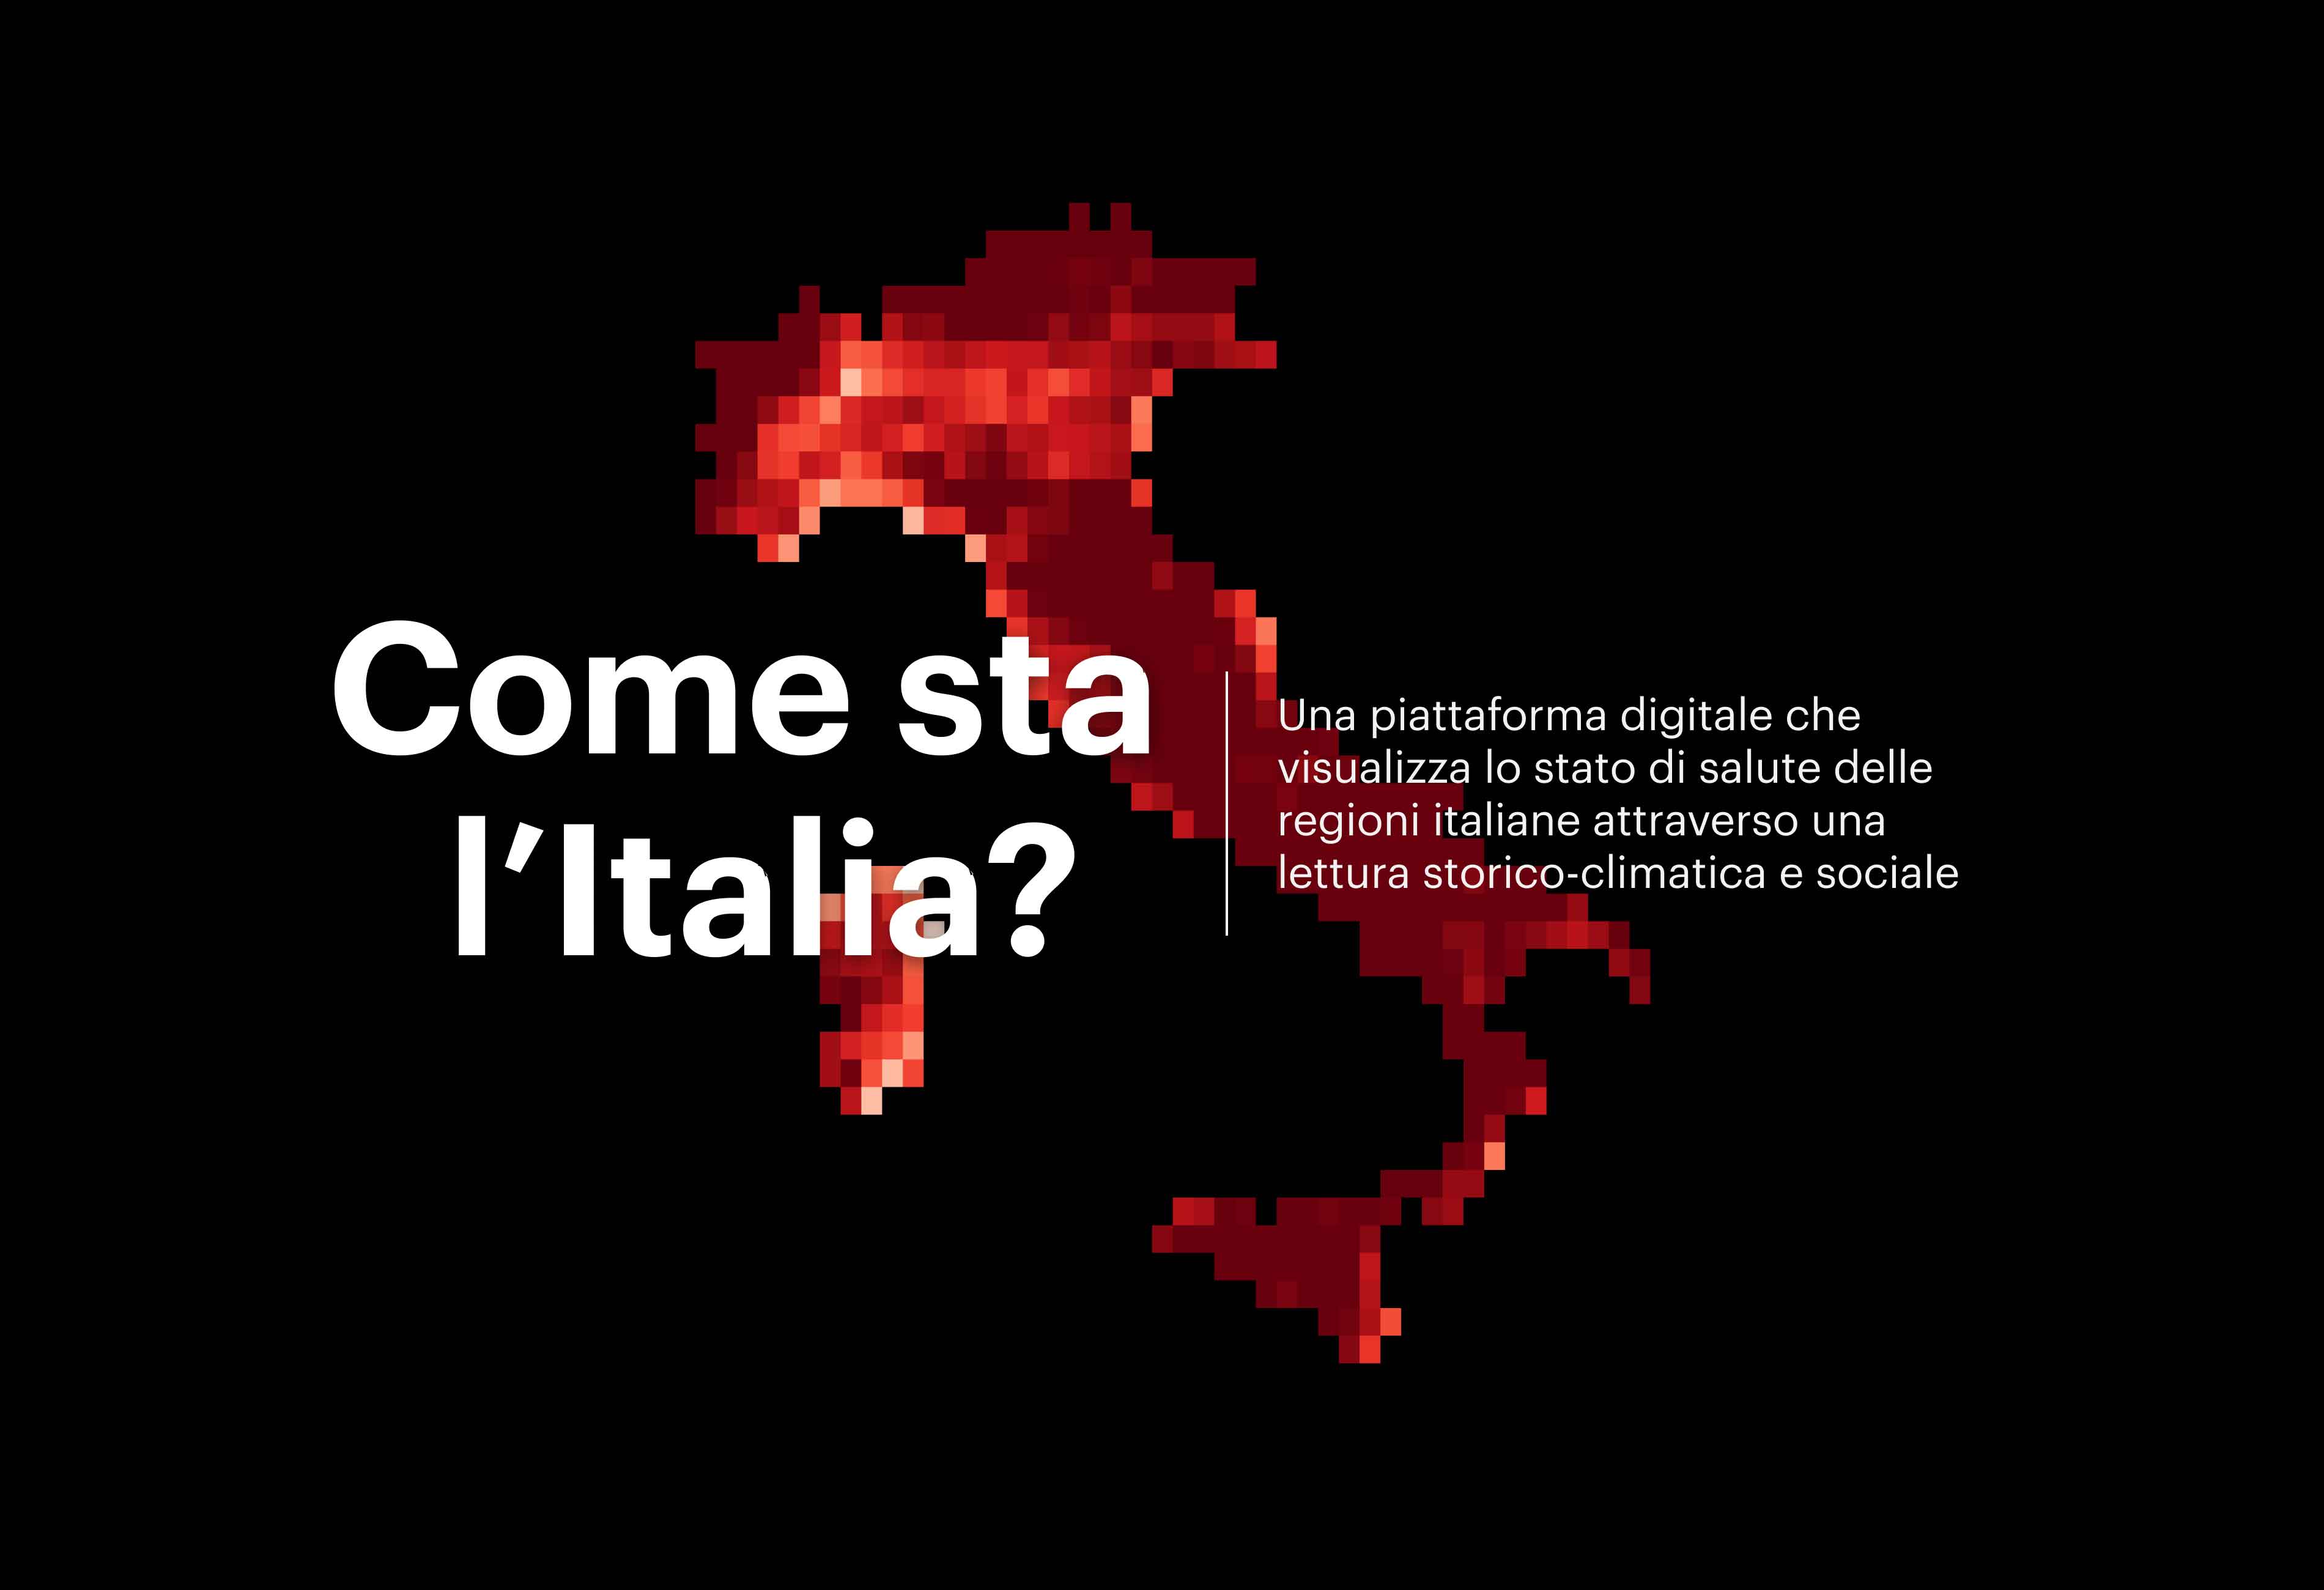
“Come sta l'Italia? / How is Italy doing?” is a digital platform showcasing extreme climate events
occurred in Italy since 1981.
The "health conditions" of the twenty Italian regions are visualised through a historical, climate
and social analysis. Climate change events are perceived as a world-scale problem: they can be
difficult to comprehend for people who do not feel their impact on everyday life.
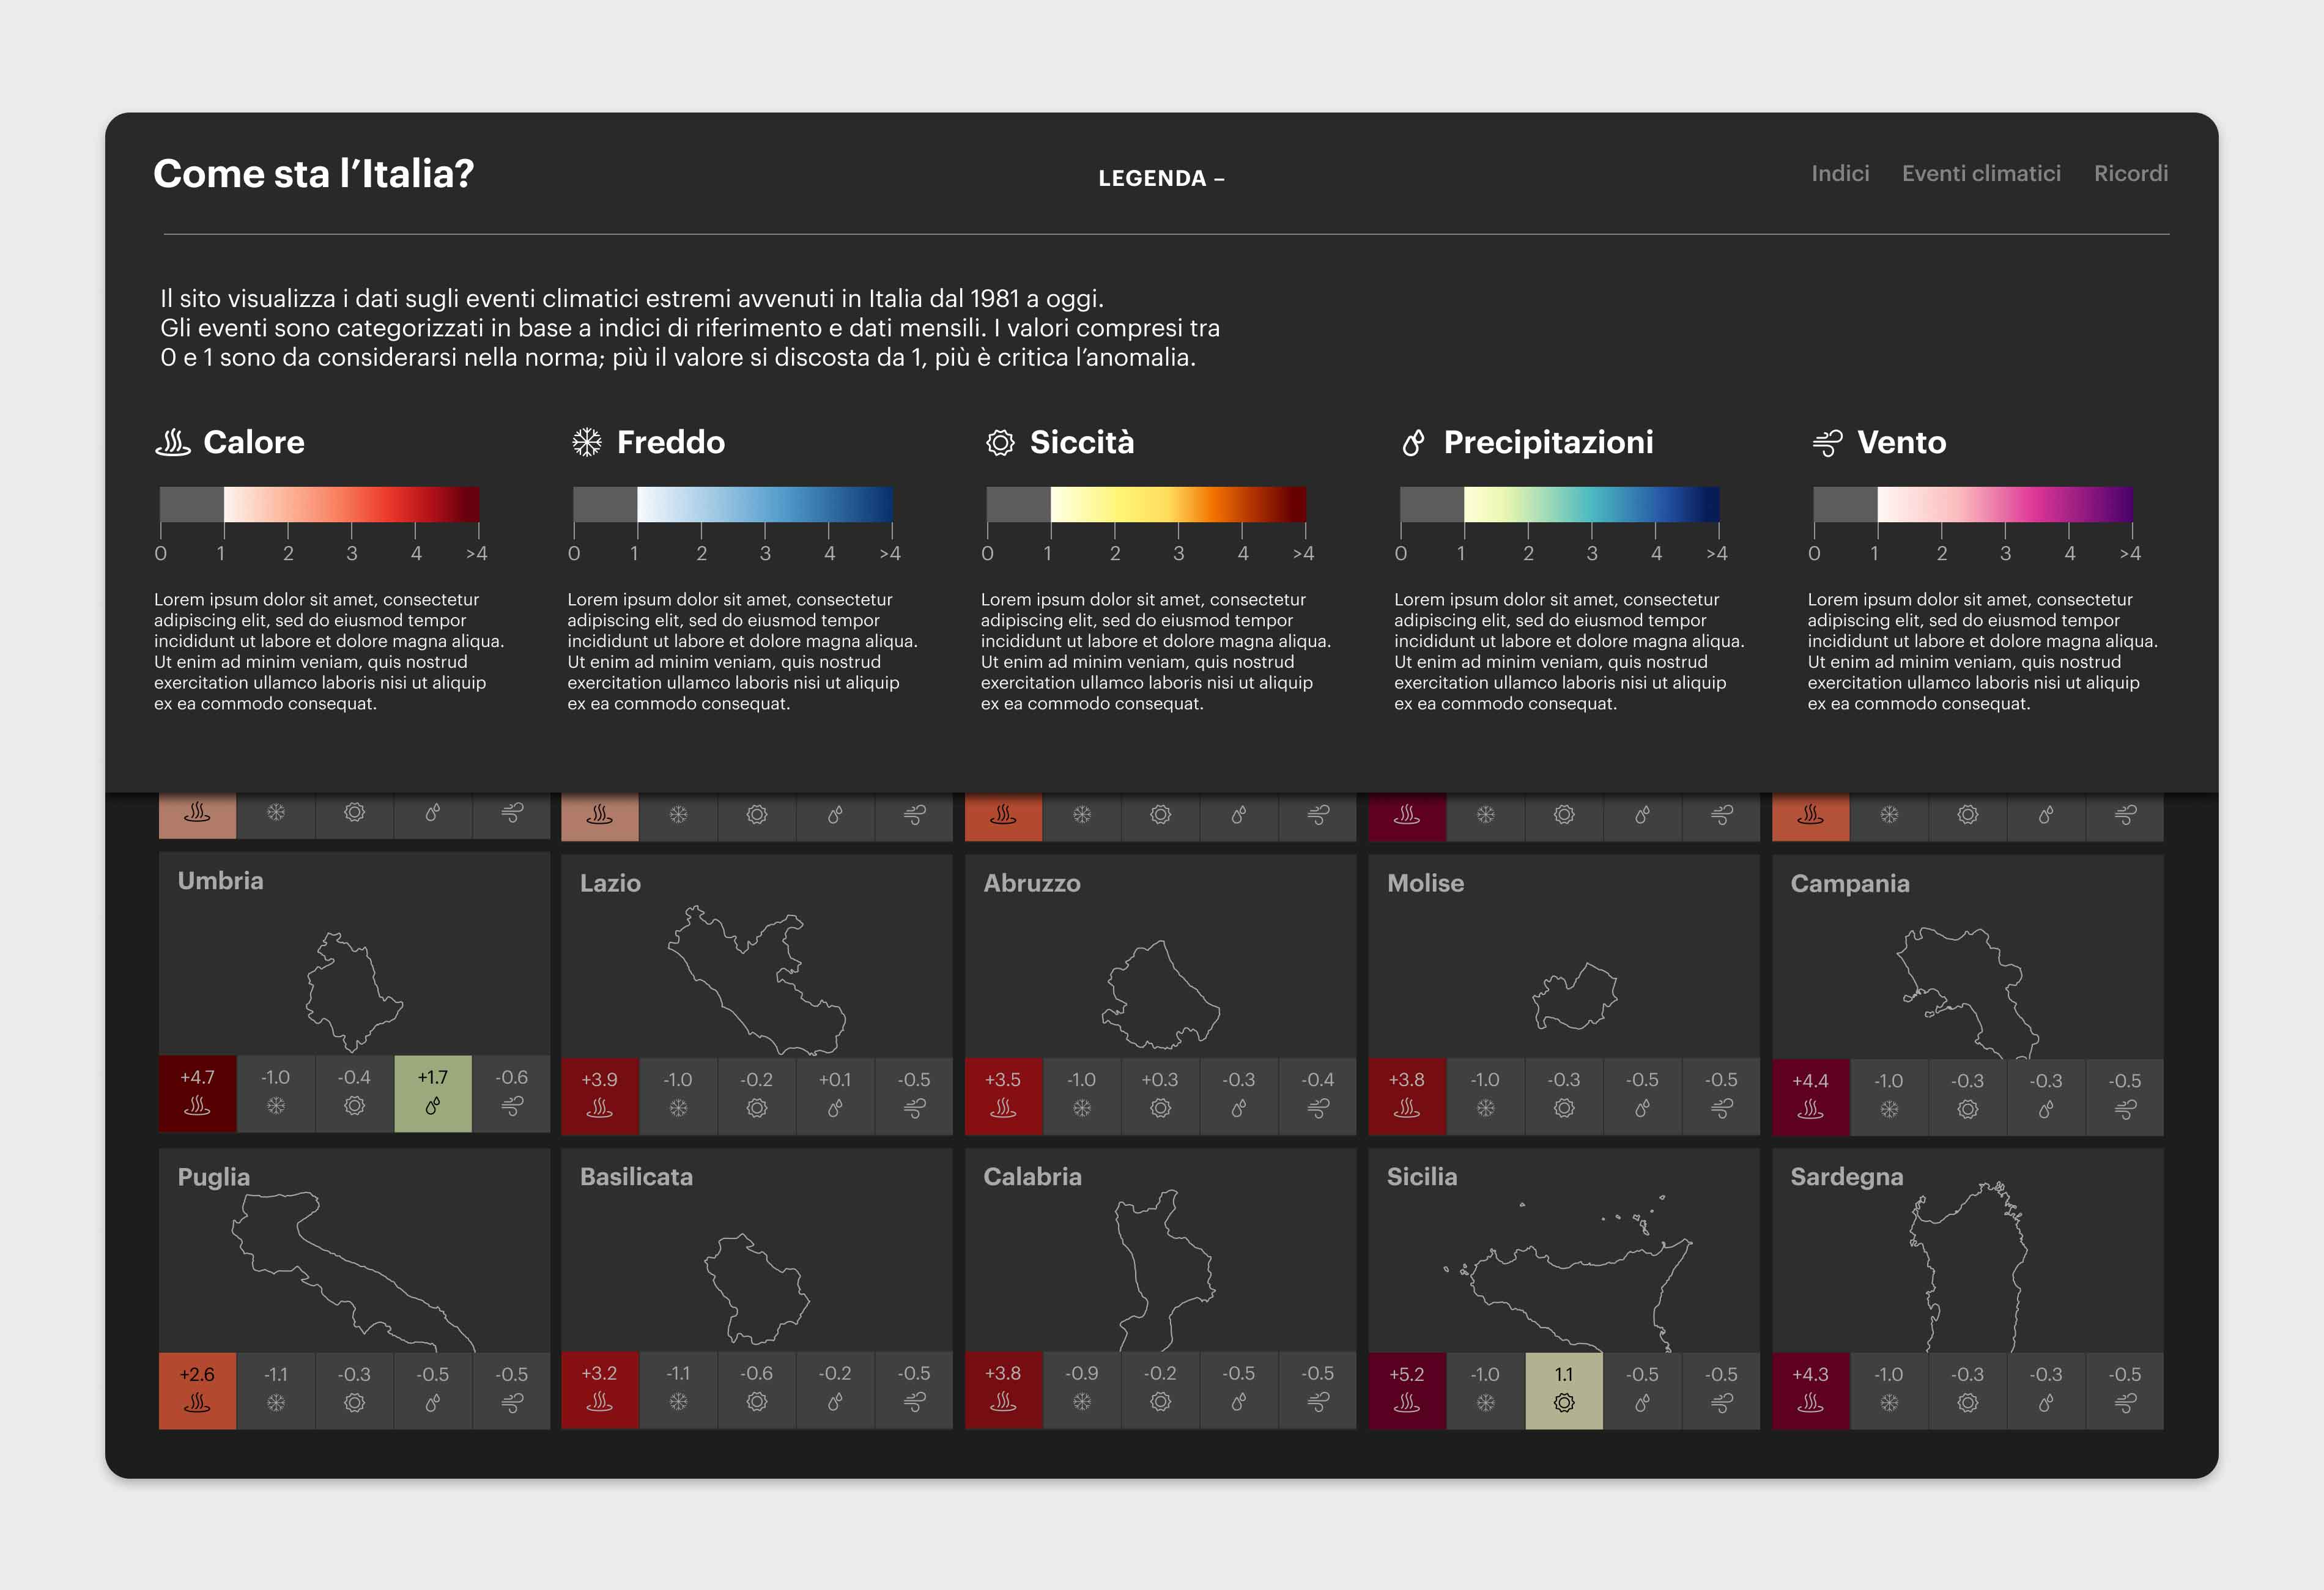
How is Italy doing? monitors the Italian territory with climate data from 1981 to nowadays,
organised by indices developed by the European Extreme Events Climate Index ↗. The indices
(cold,
heat, drought, precipitation and wind) provide information about the areas affected by different
types of weather-induced hazards and the severity of such events.
Combining the E3CI indices with population data and land use, we obtain an analysis of Italy on a
regional scale with a historical and climate perspective. Furthermore, by giving the opportunity to
share memories to the users, we can validate events that might not be labeled as extreme but had
anyway an impact on people.
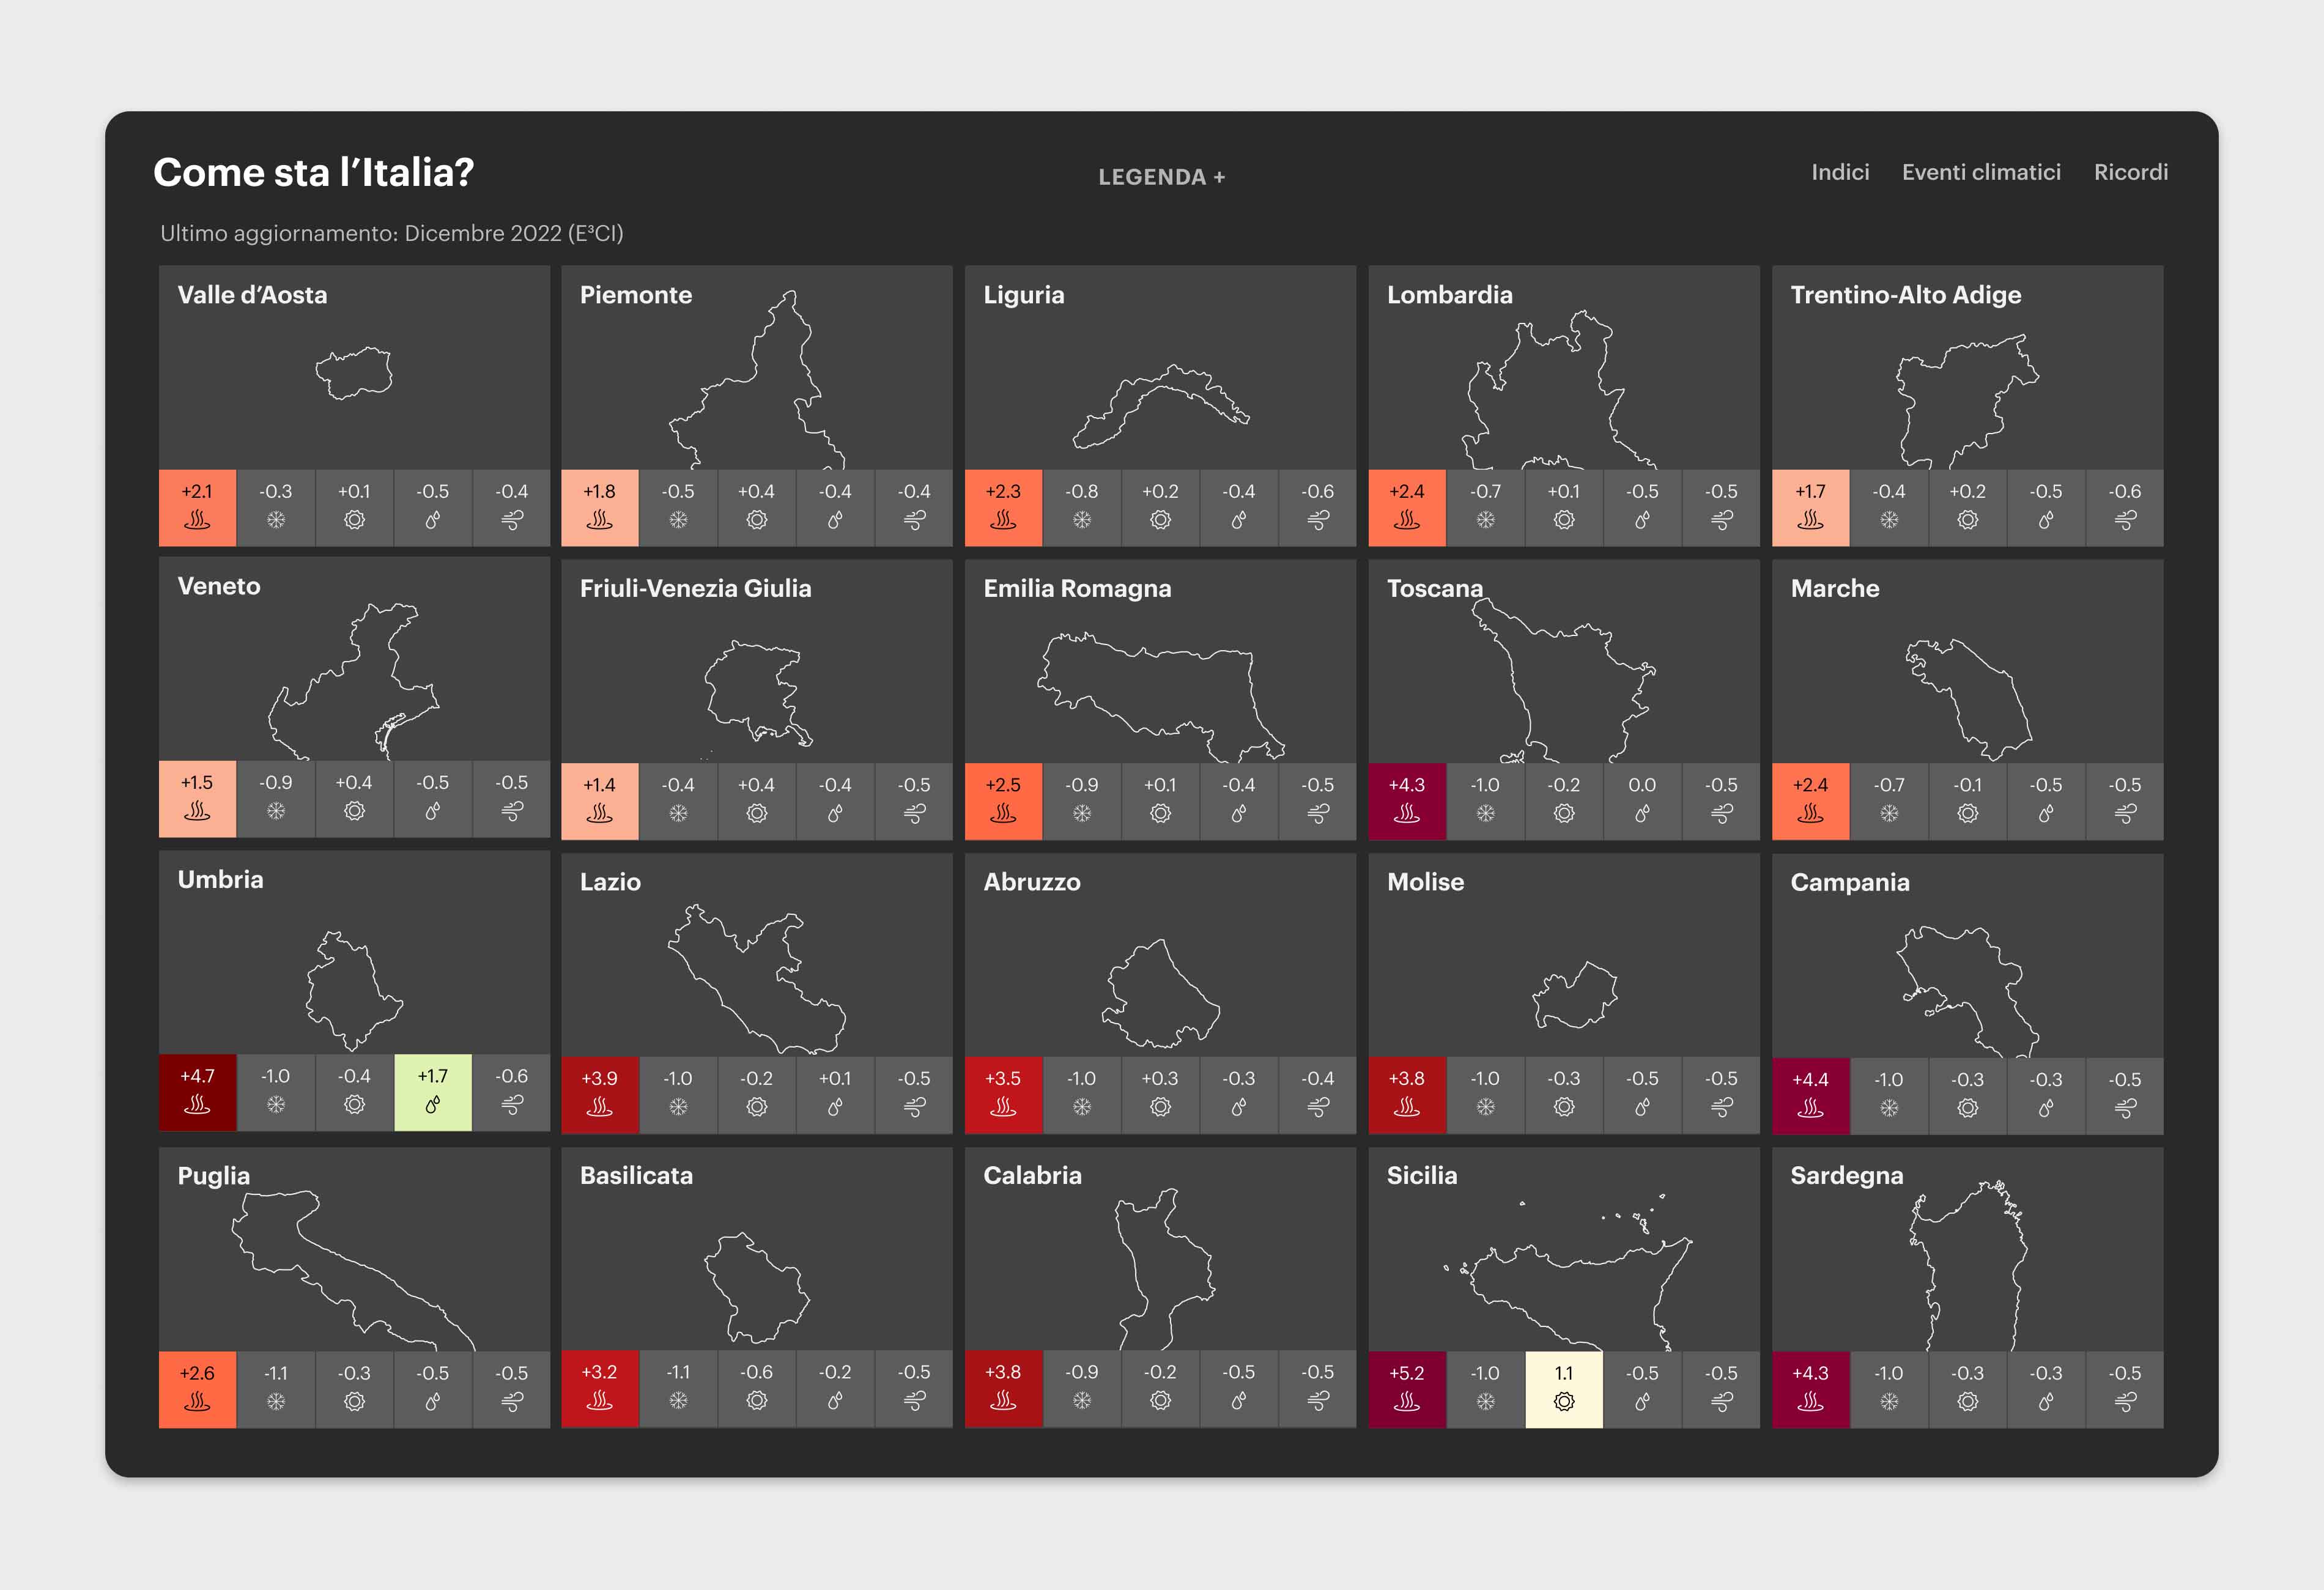
The homepage showcases the latest values for each region: the ones that
are above the norm are highlighted with a specific colour. The higher the value, the more critical
the
weather event.
Five types of extreme weather events - heatwaves, cold spells, droughts, intense precipitation, and
wind
storms - are evaluated based on numerical indices. An event is considered extreme if it exceeds
natural
variability, as determined by statistical analysis, and corresponds to values exceeding 1. Note that
the
severity of an event is proportional to its numerical value, with higher values indicating rarer and
more
severe events.
Each indicator is expressed on the homepage both with the use of colour and icons to support people with visual impairment.
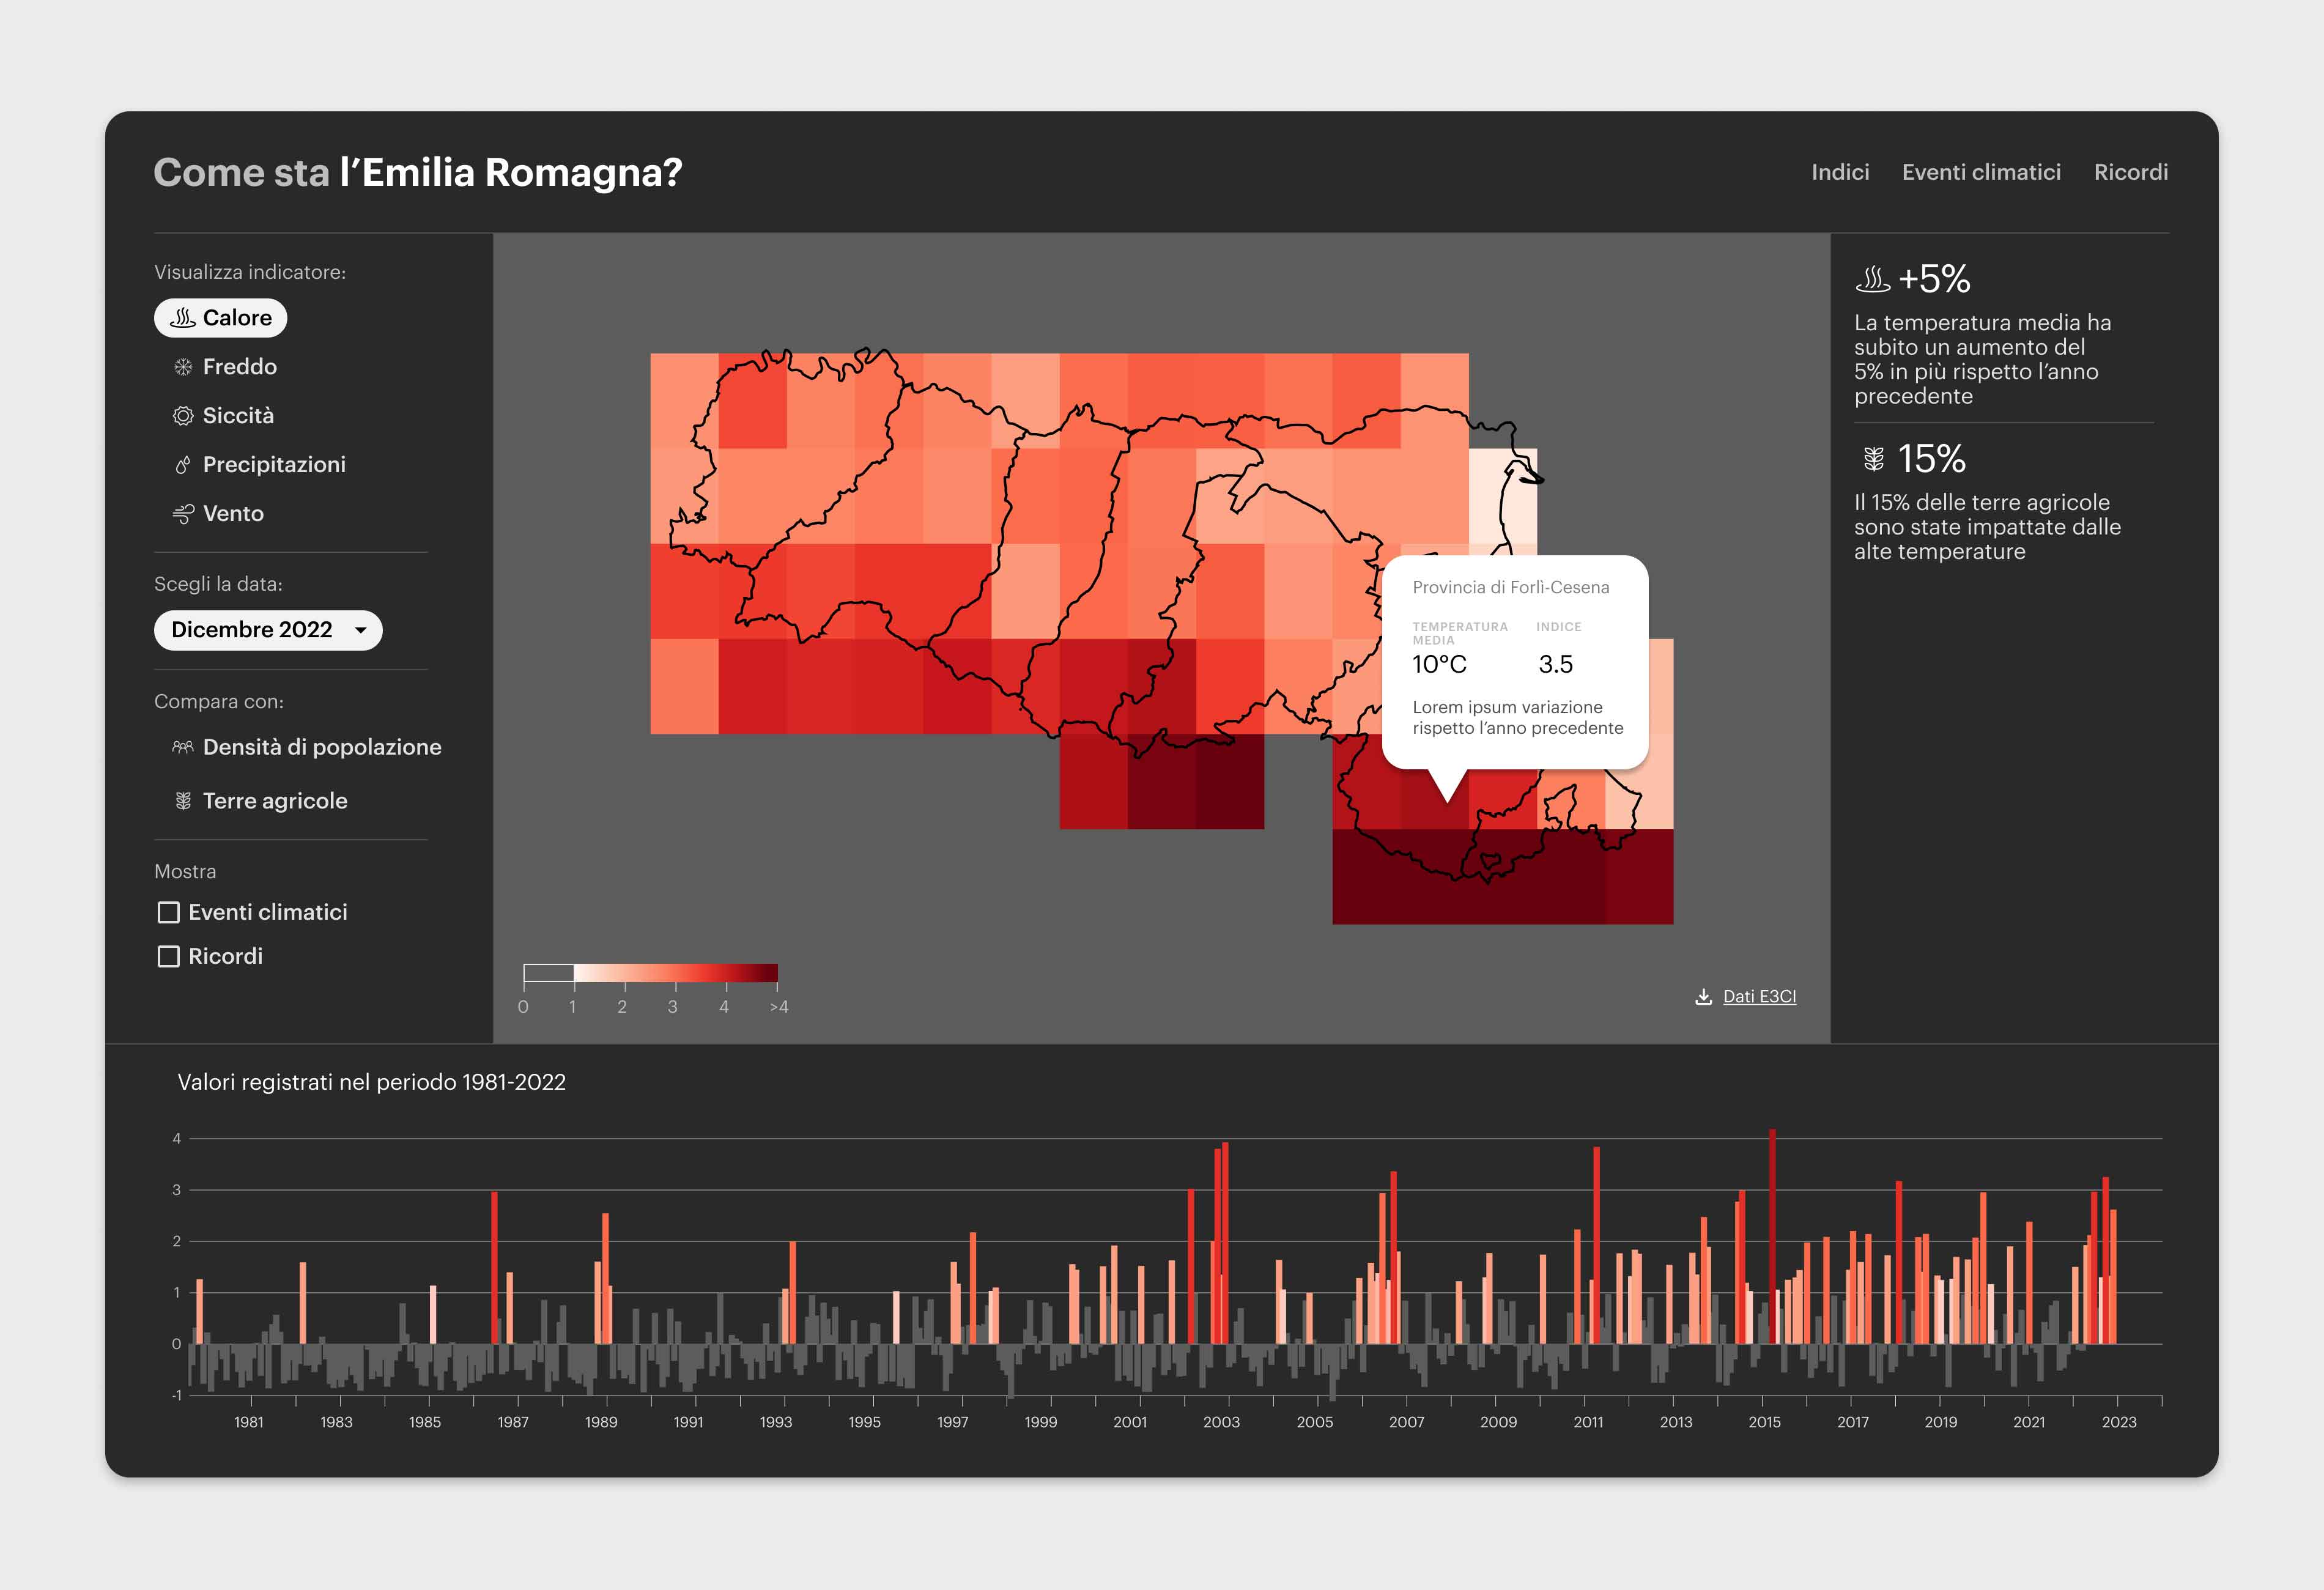
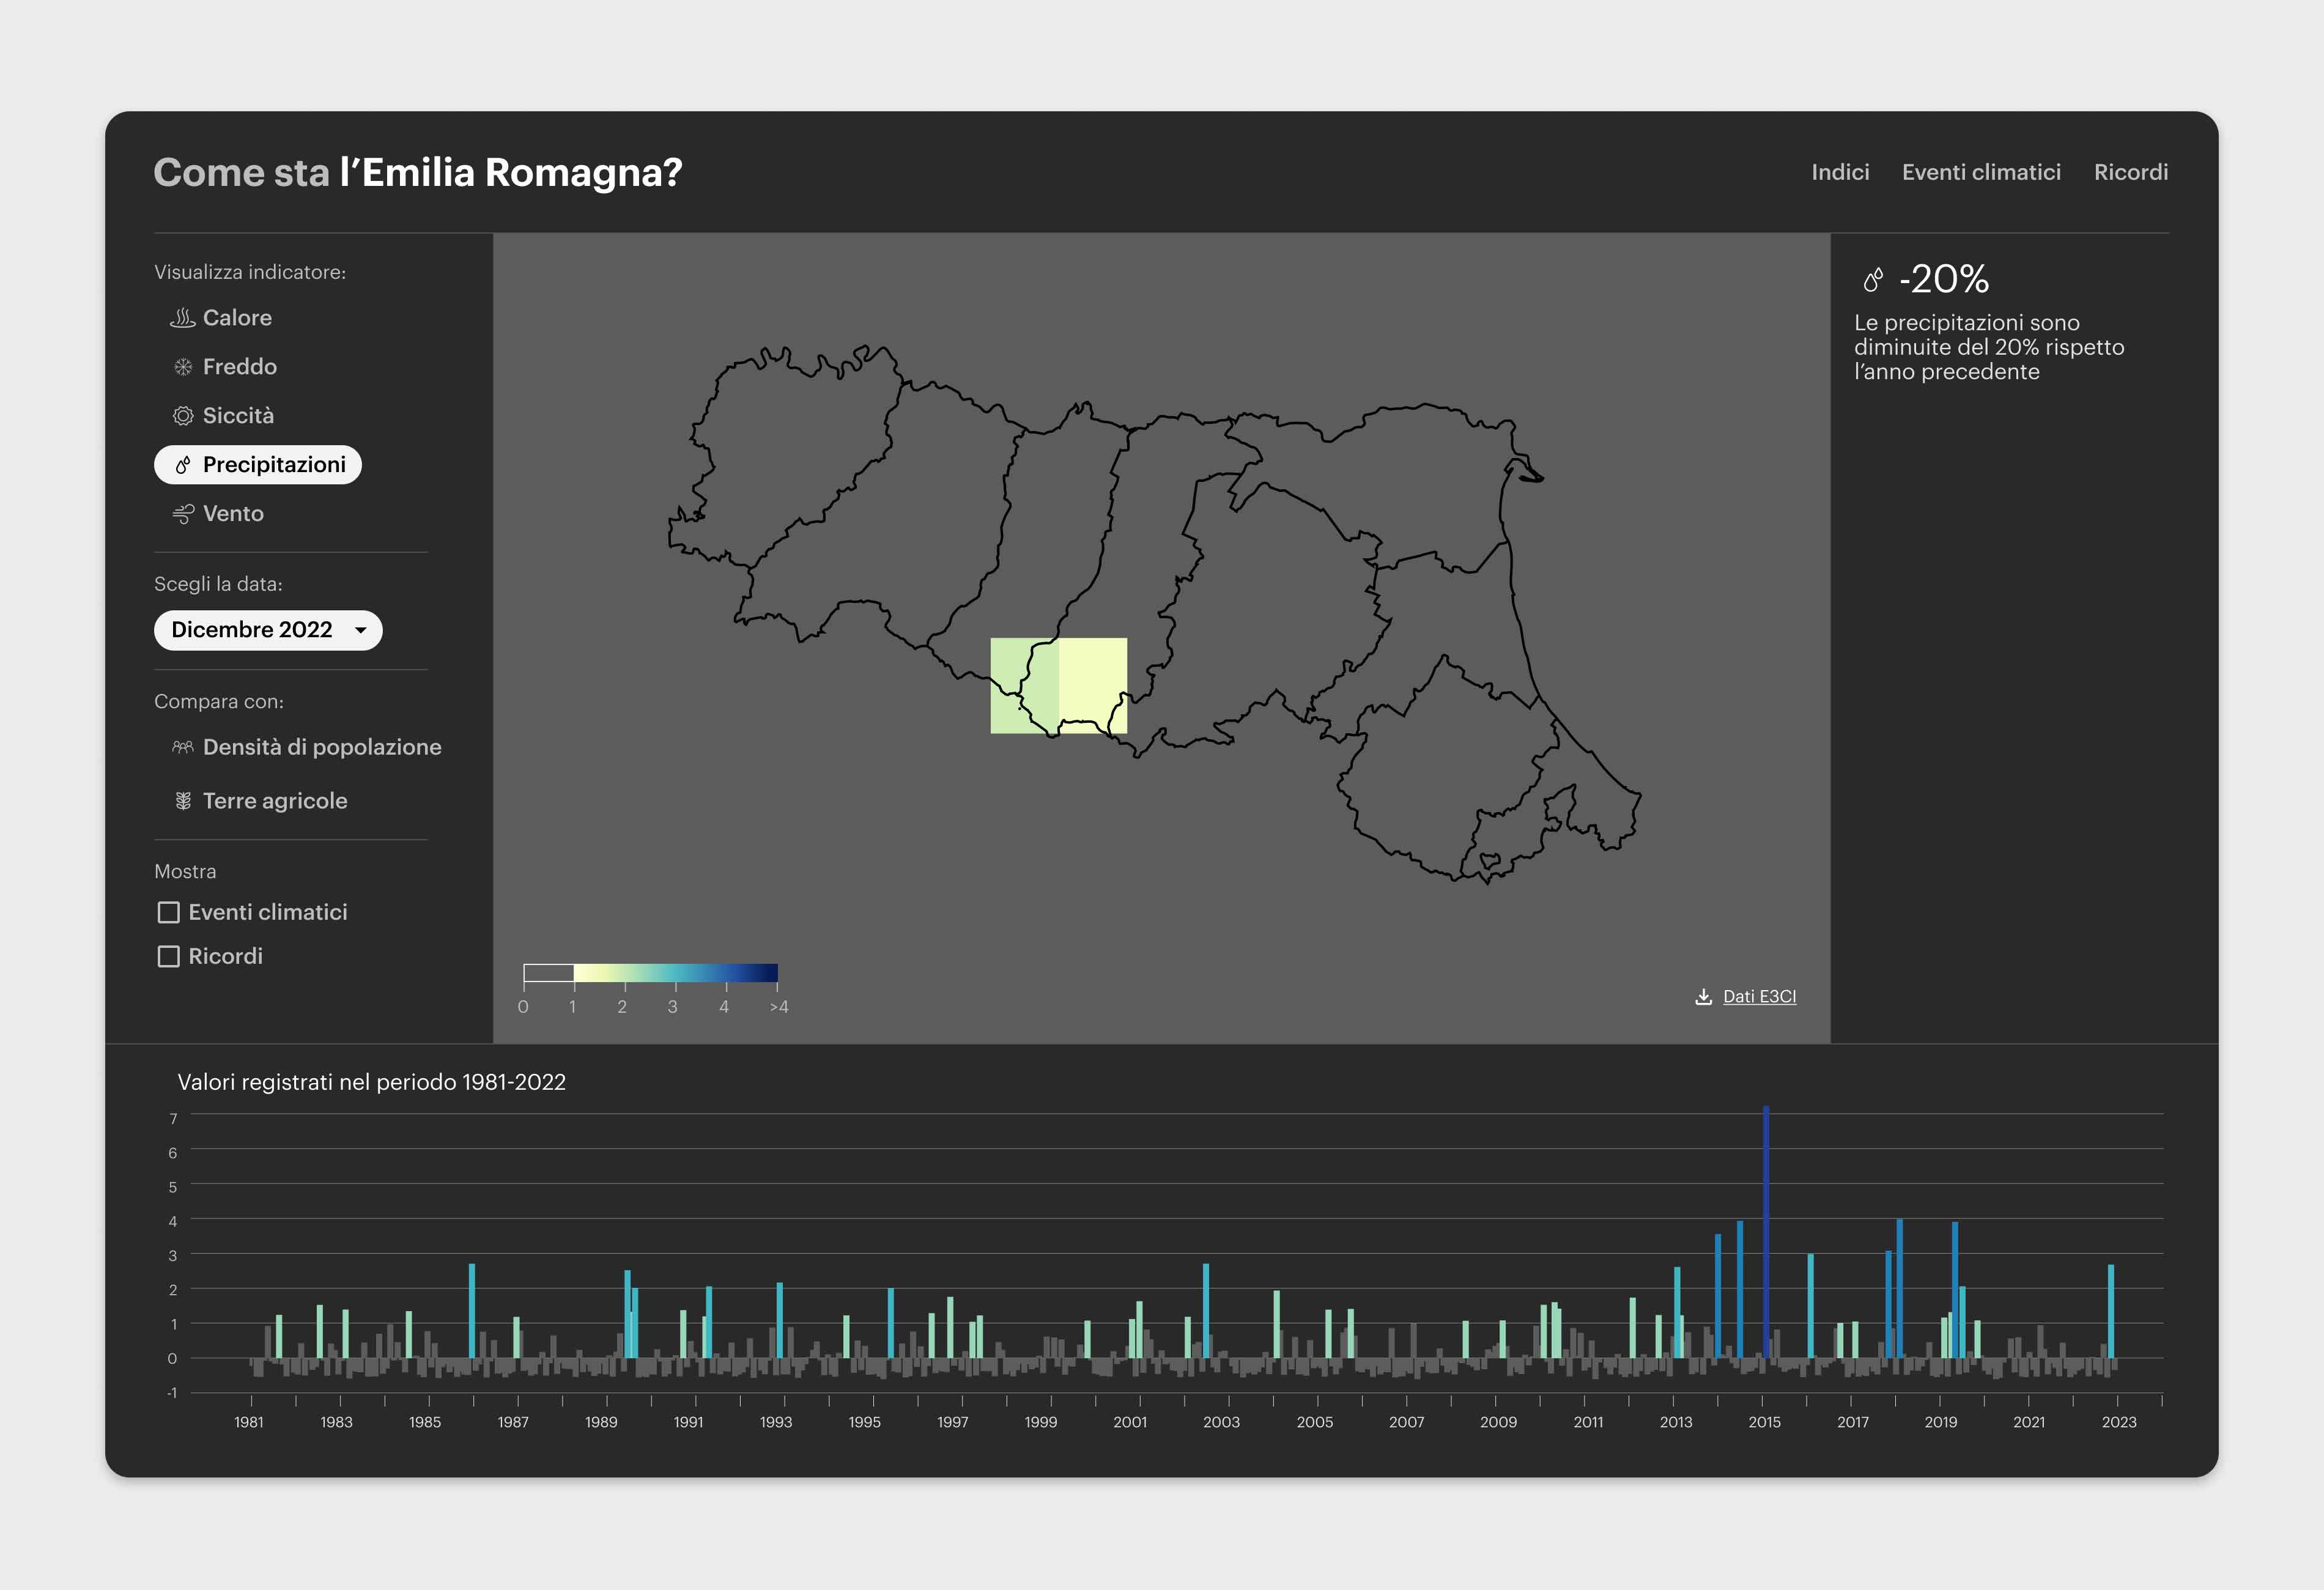
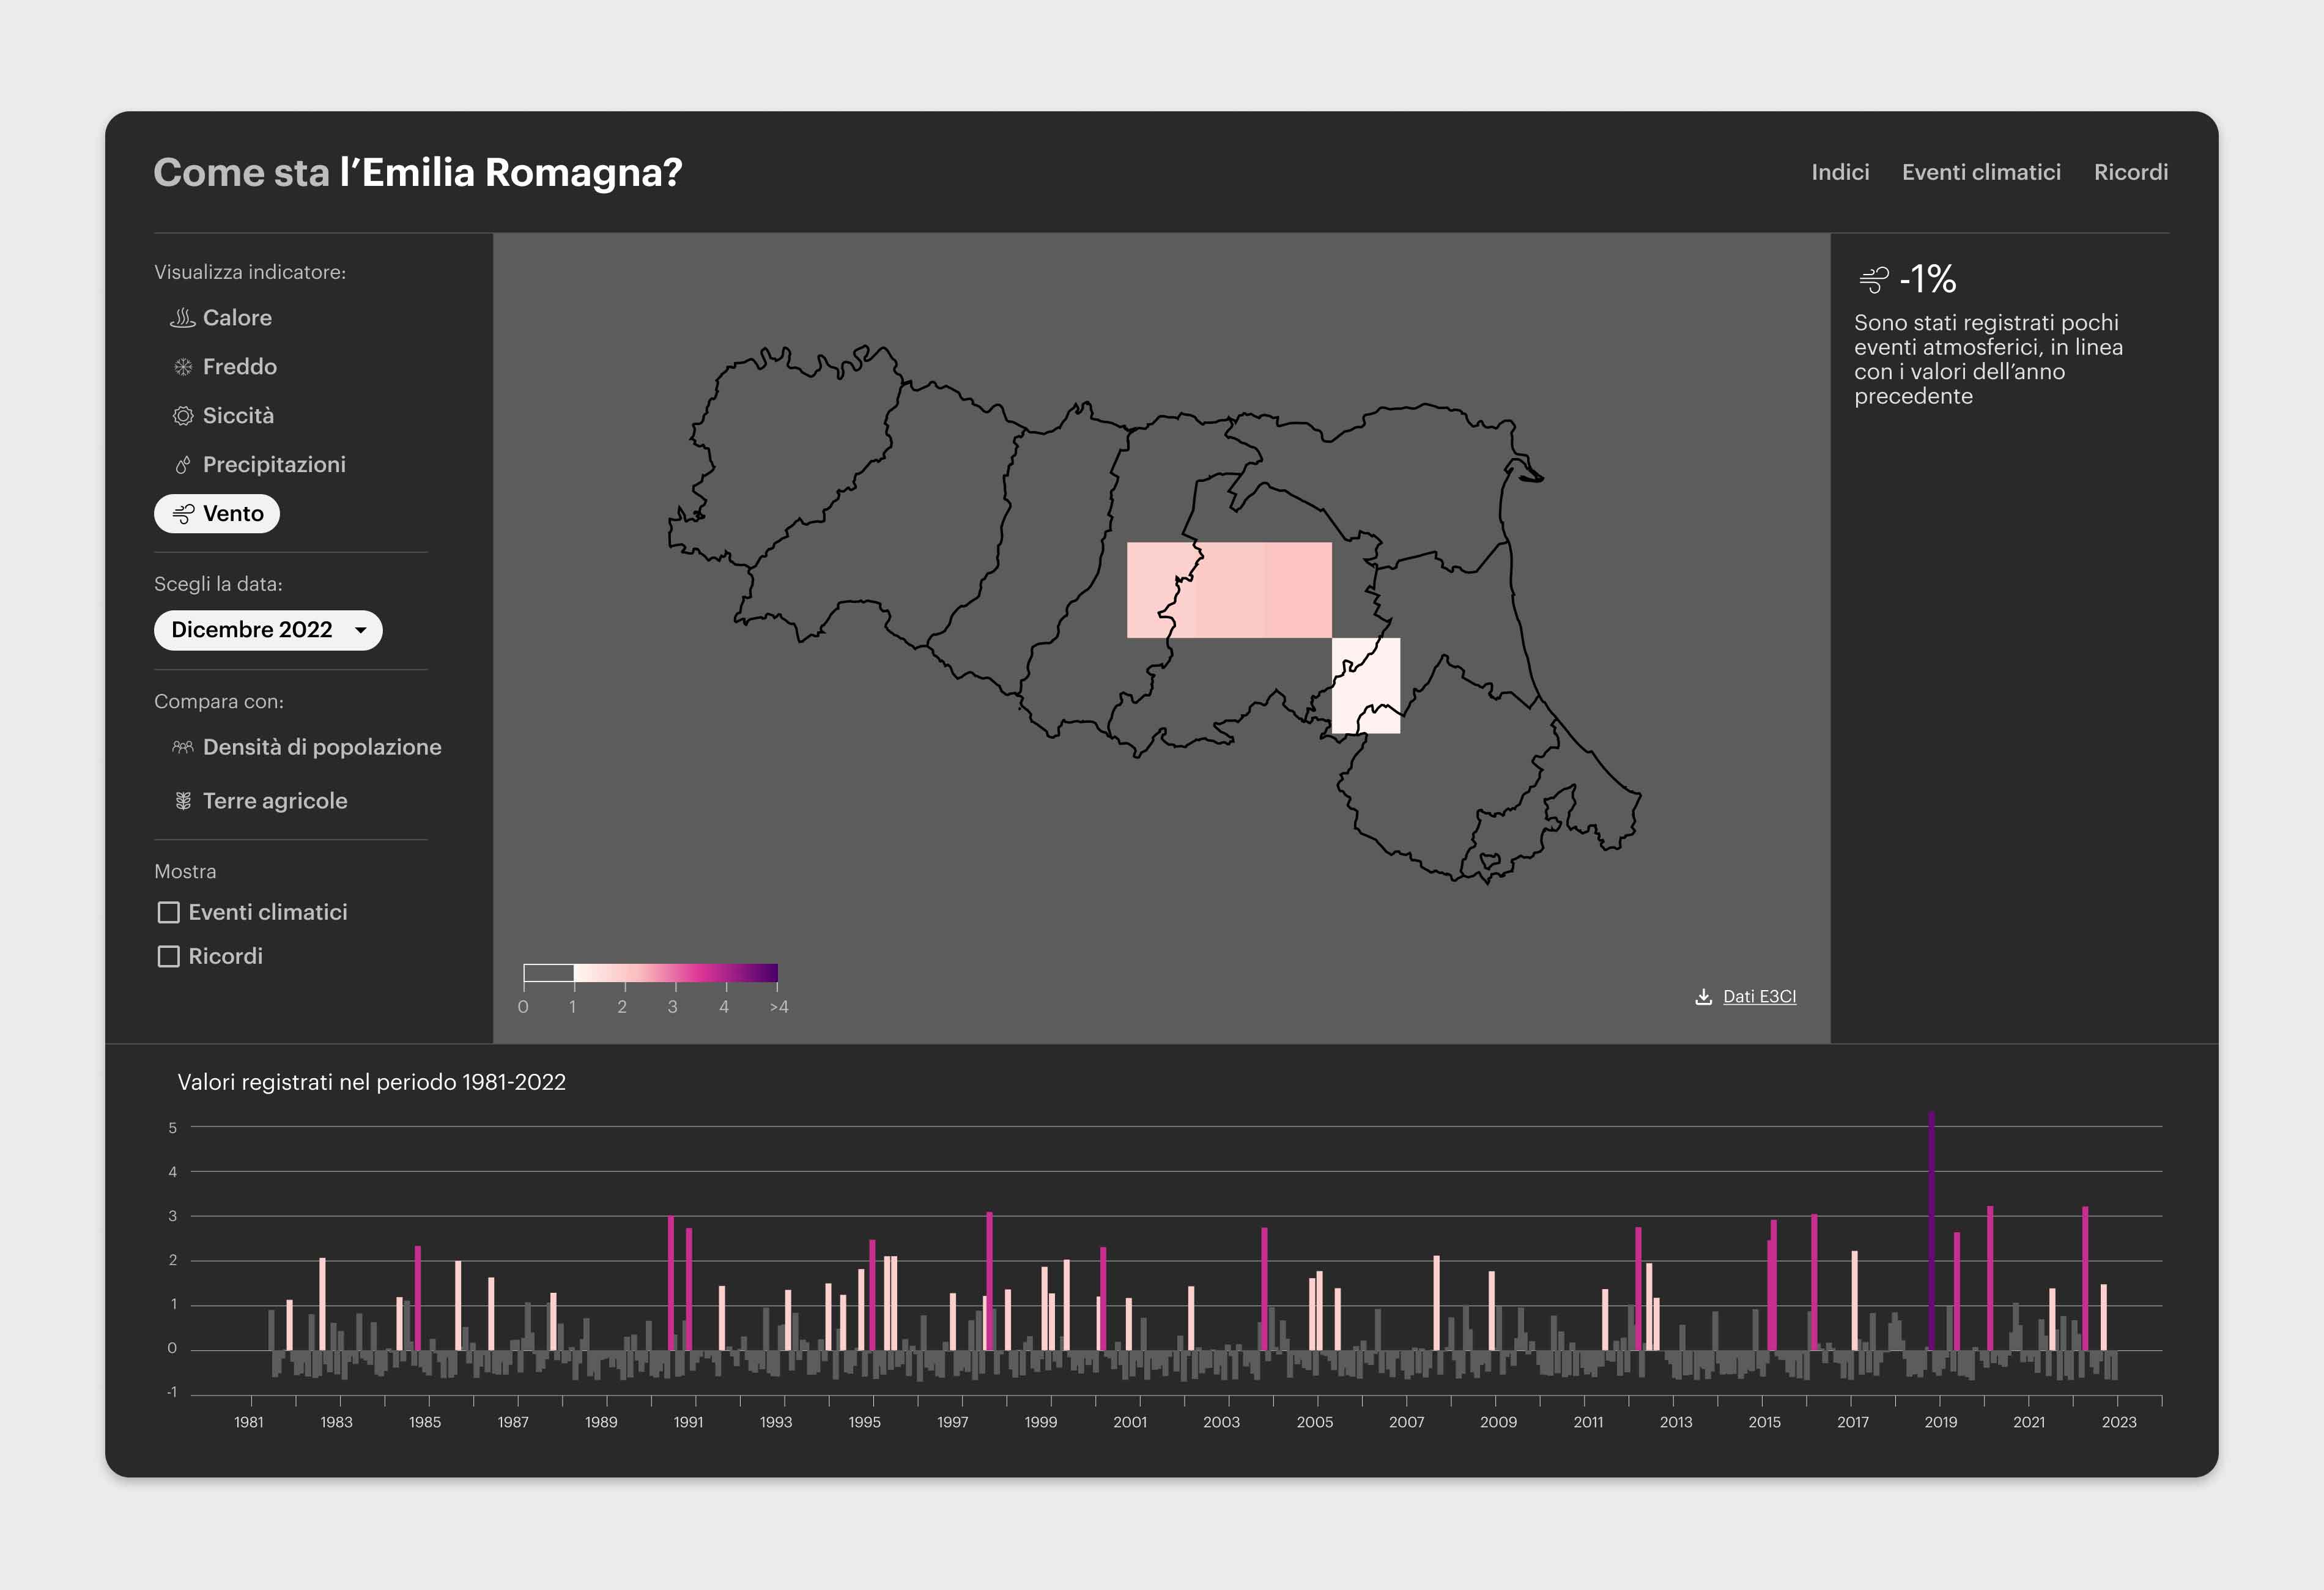
A map of the heatwave index for the Emilia-Romagna region in December 2022. The heatwave index – as all the other indices in this work – is computed on a grid. The dark red areas indicate higher values of the index: December 2022 has indeed been significantly warmer than the average December on the entire Italian territory. The accompanying time series illustrates the monthly heatwave index values for the Emilia-Romagna region, allowing for easy identification and comparison of extreme events. Aside, an auto-generated text sums-up the most important data.
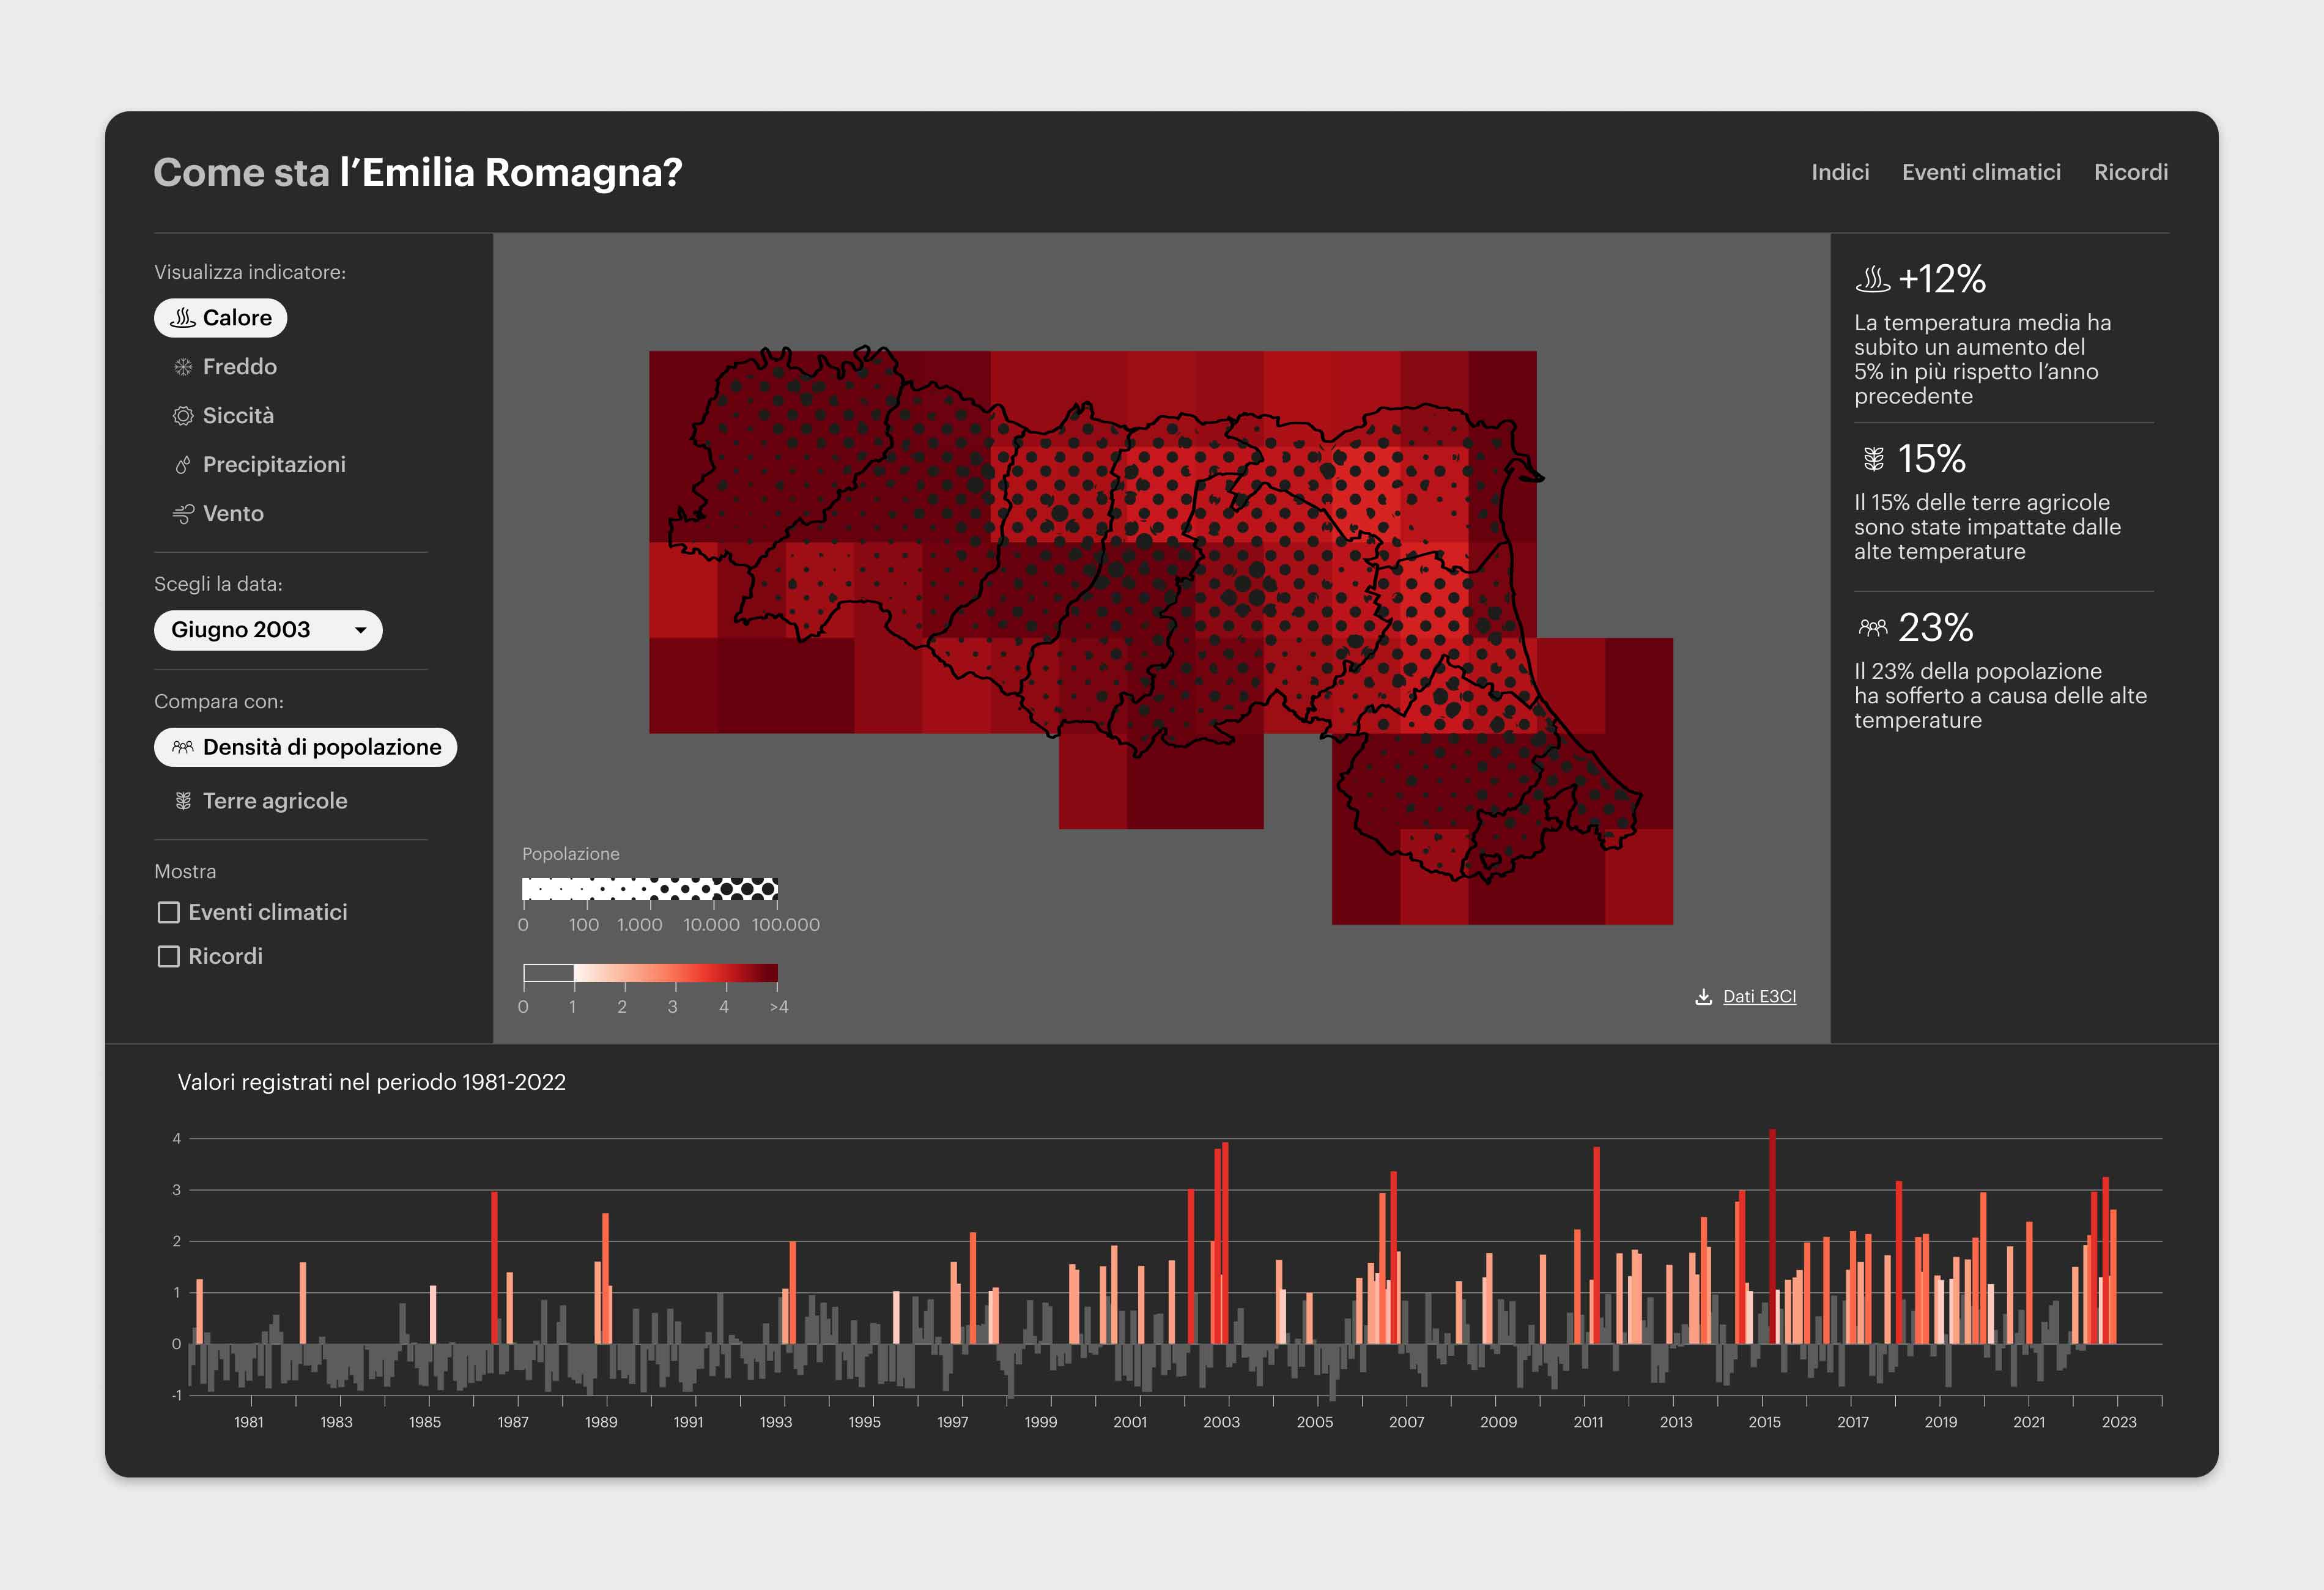
The indices describing extreme weather events can also provide insights about the past. For instance, the summer of 2003 was marked by widespread extreme heatwaves across Europe. This map illustrates the heatwave index for the Emilia-Romagna region during June 2003. It is interesting to compare the spatial distribution of the heatwave with that of the population: this is important information to estimate the number of people that have been exposed to such extreme temperatures.
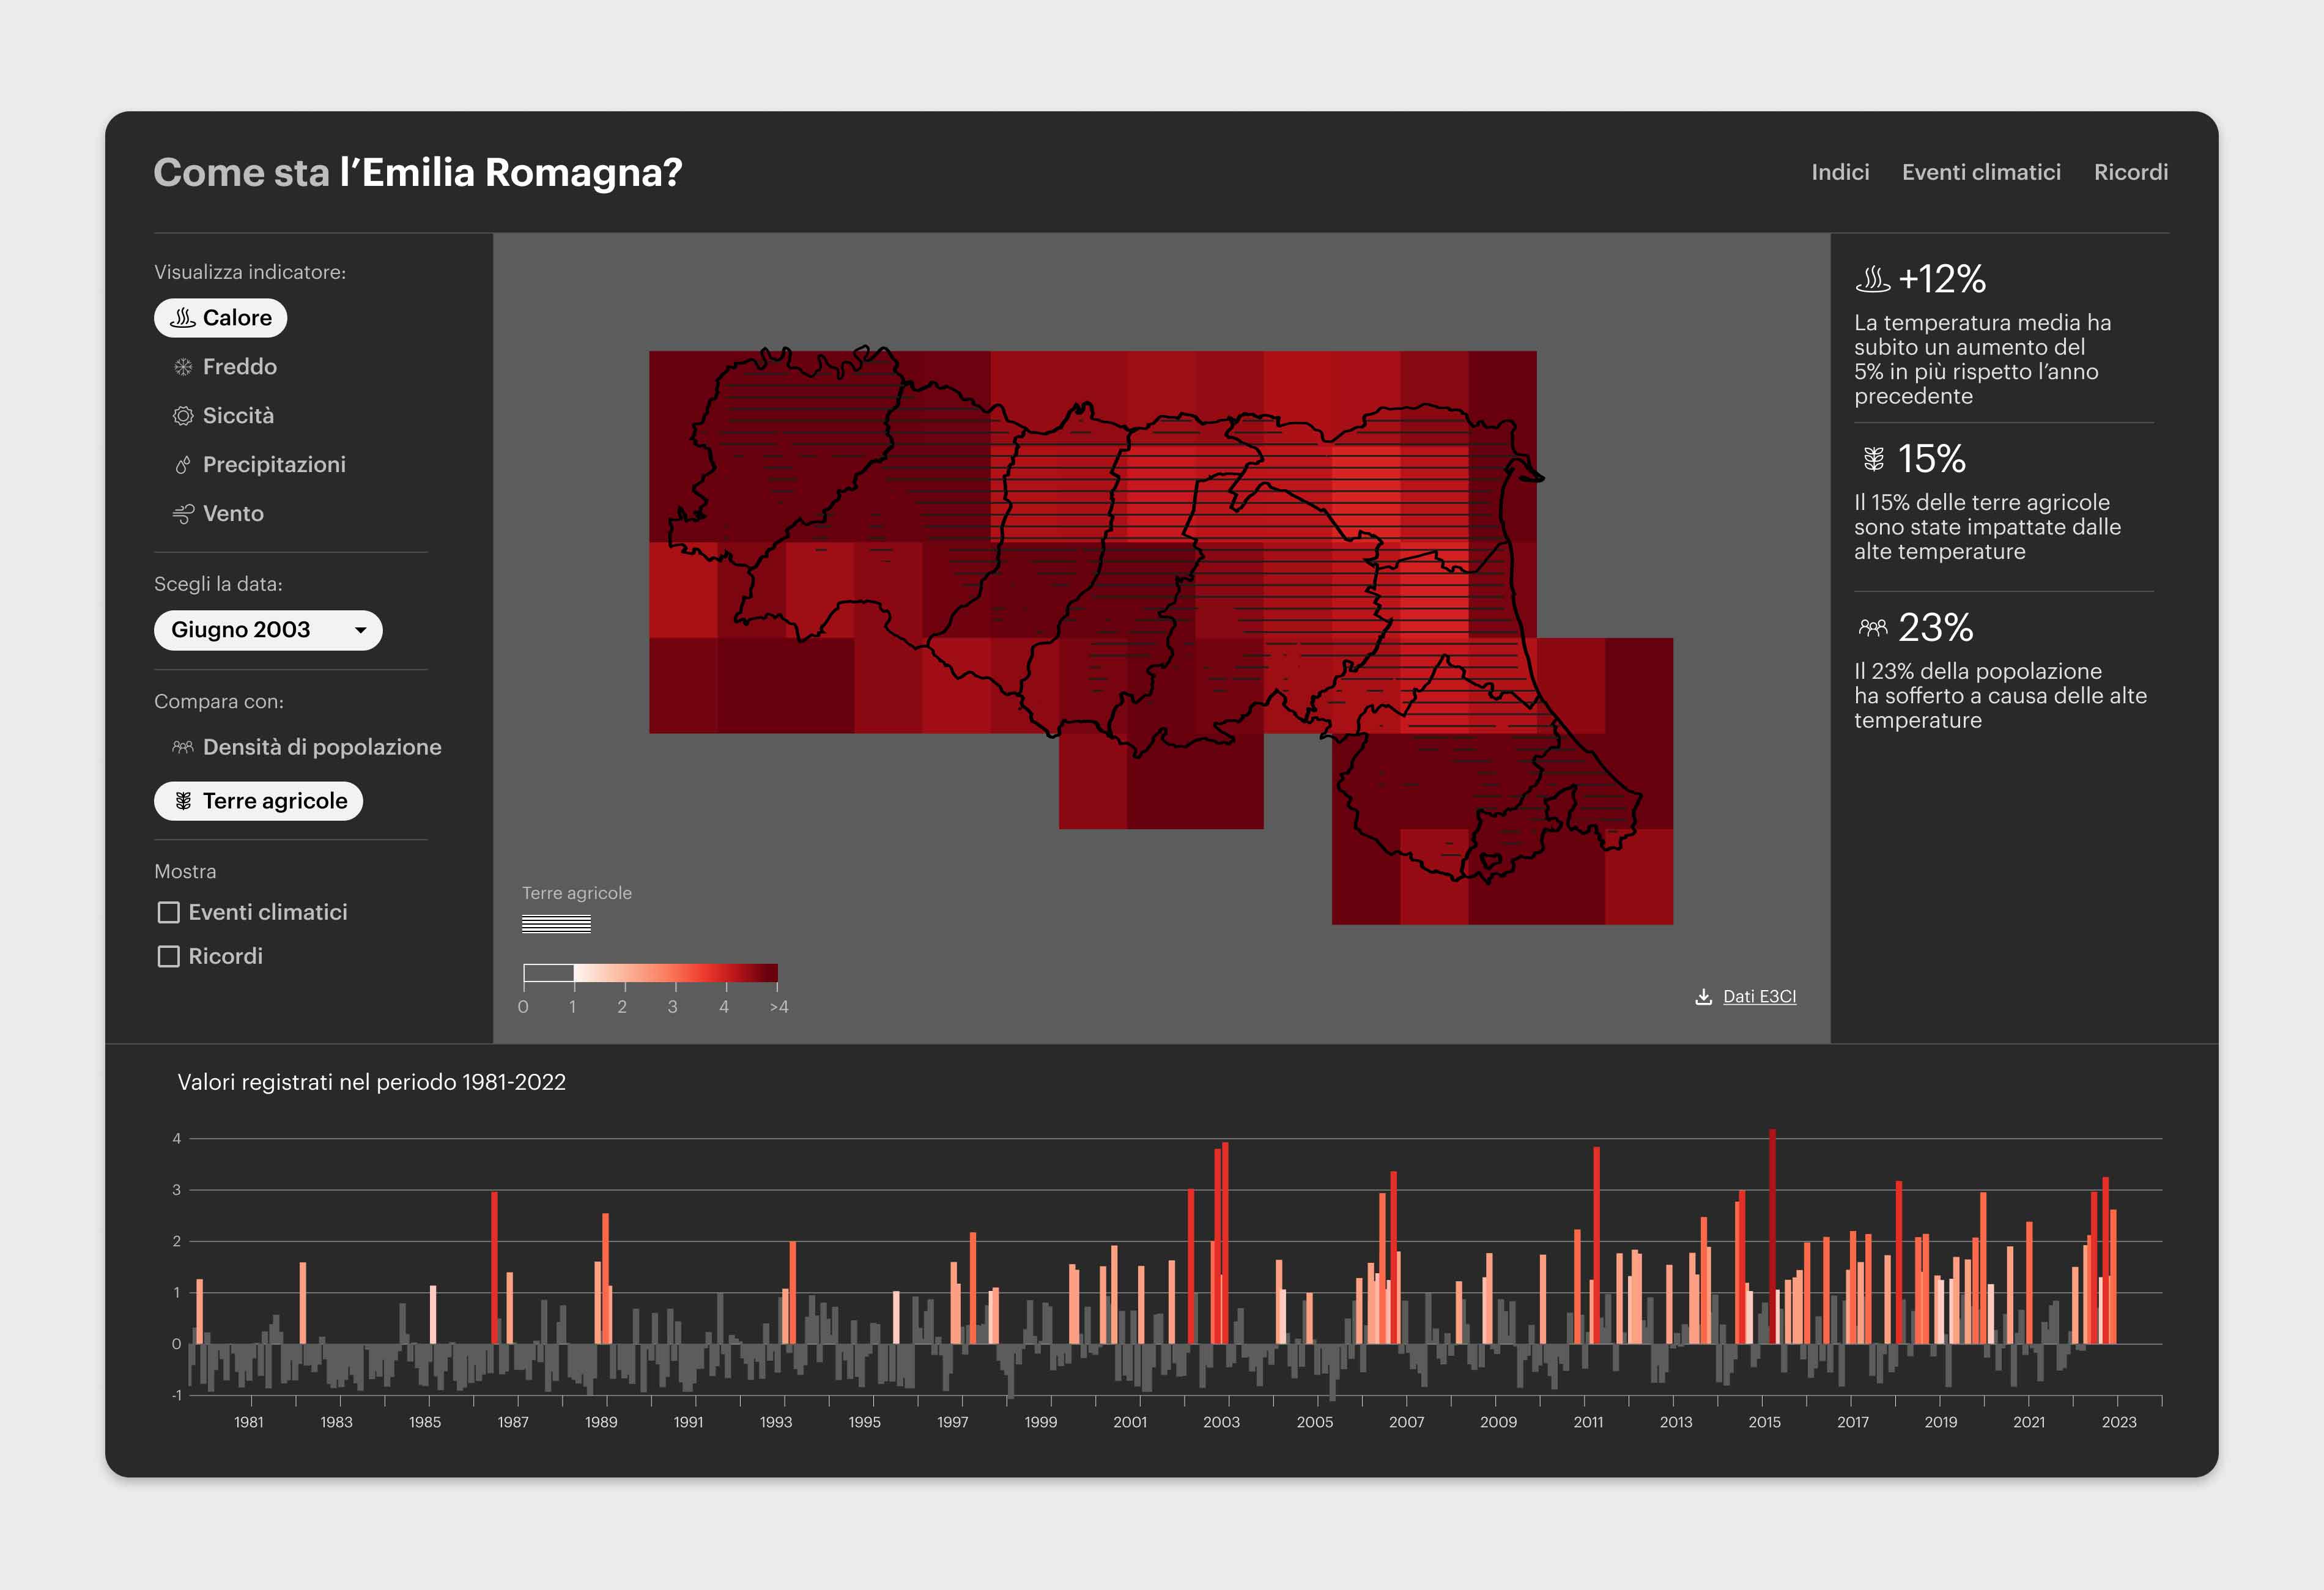
Extreme weather events can have a significant impact on human activities and supply chains, and particularly on agriculture. This comparison between the distribution of agricultural lands and the June 2003 heatwave index for the Emilia-Romagna region allows for identification of the areas where the agricultural sector has been most impacted by the event, which is crucial for assessing the economic and social impacts of heatwaves on farming communities and on the food sector.
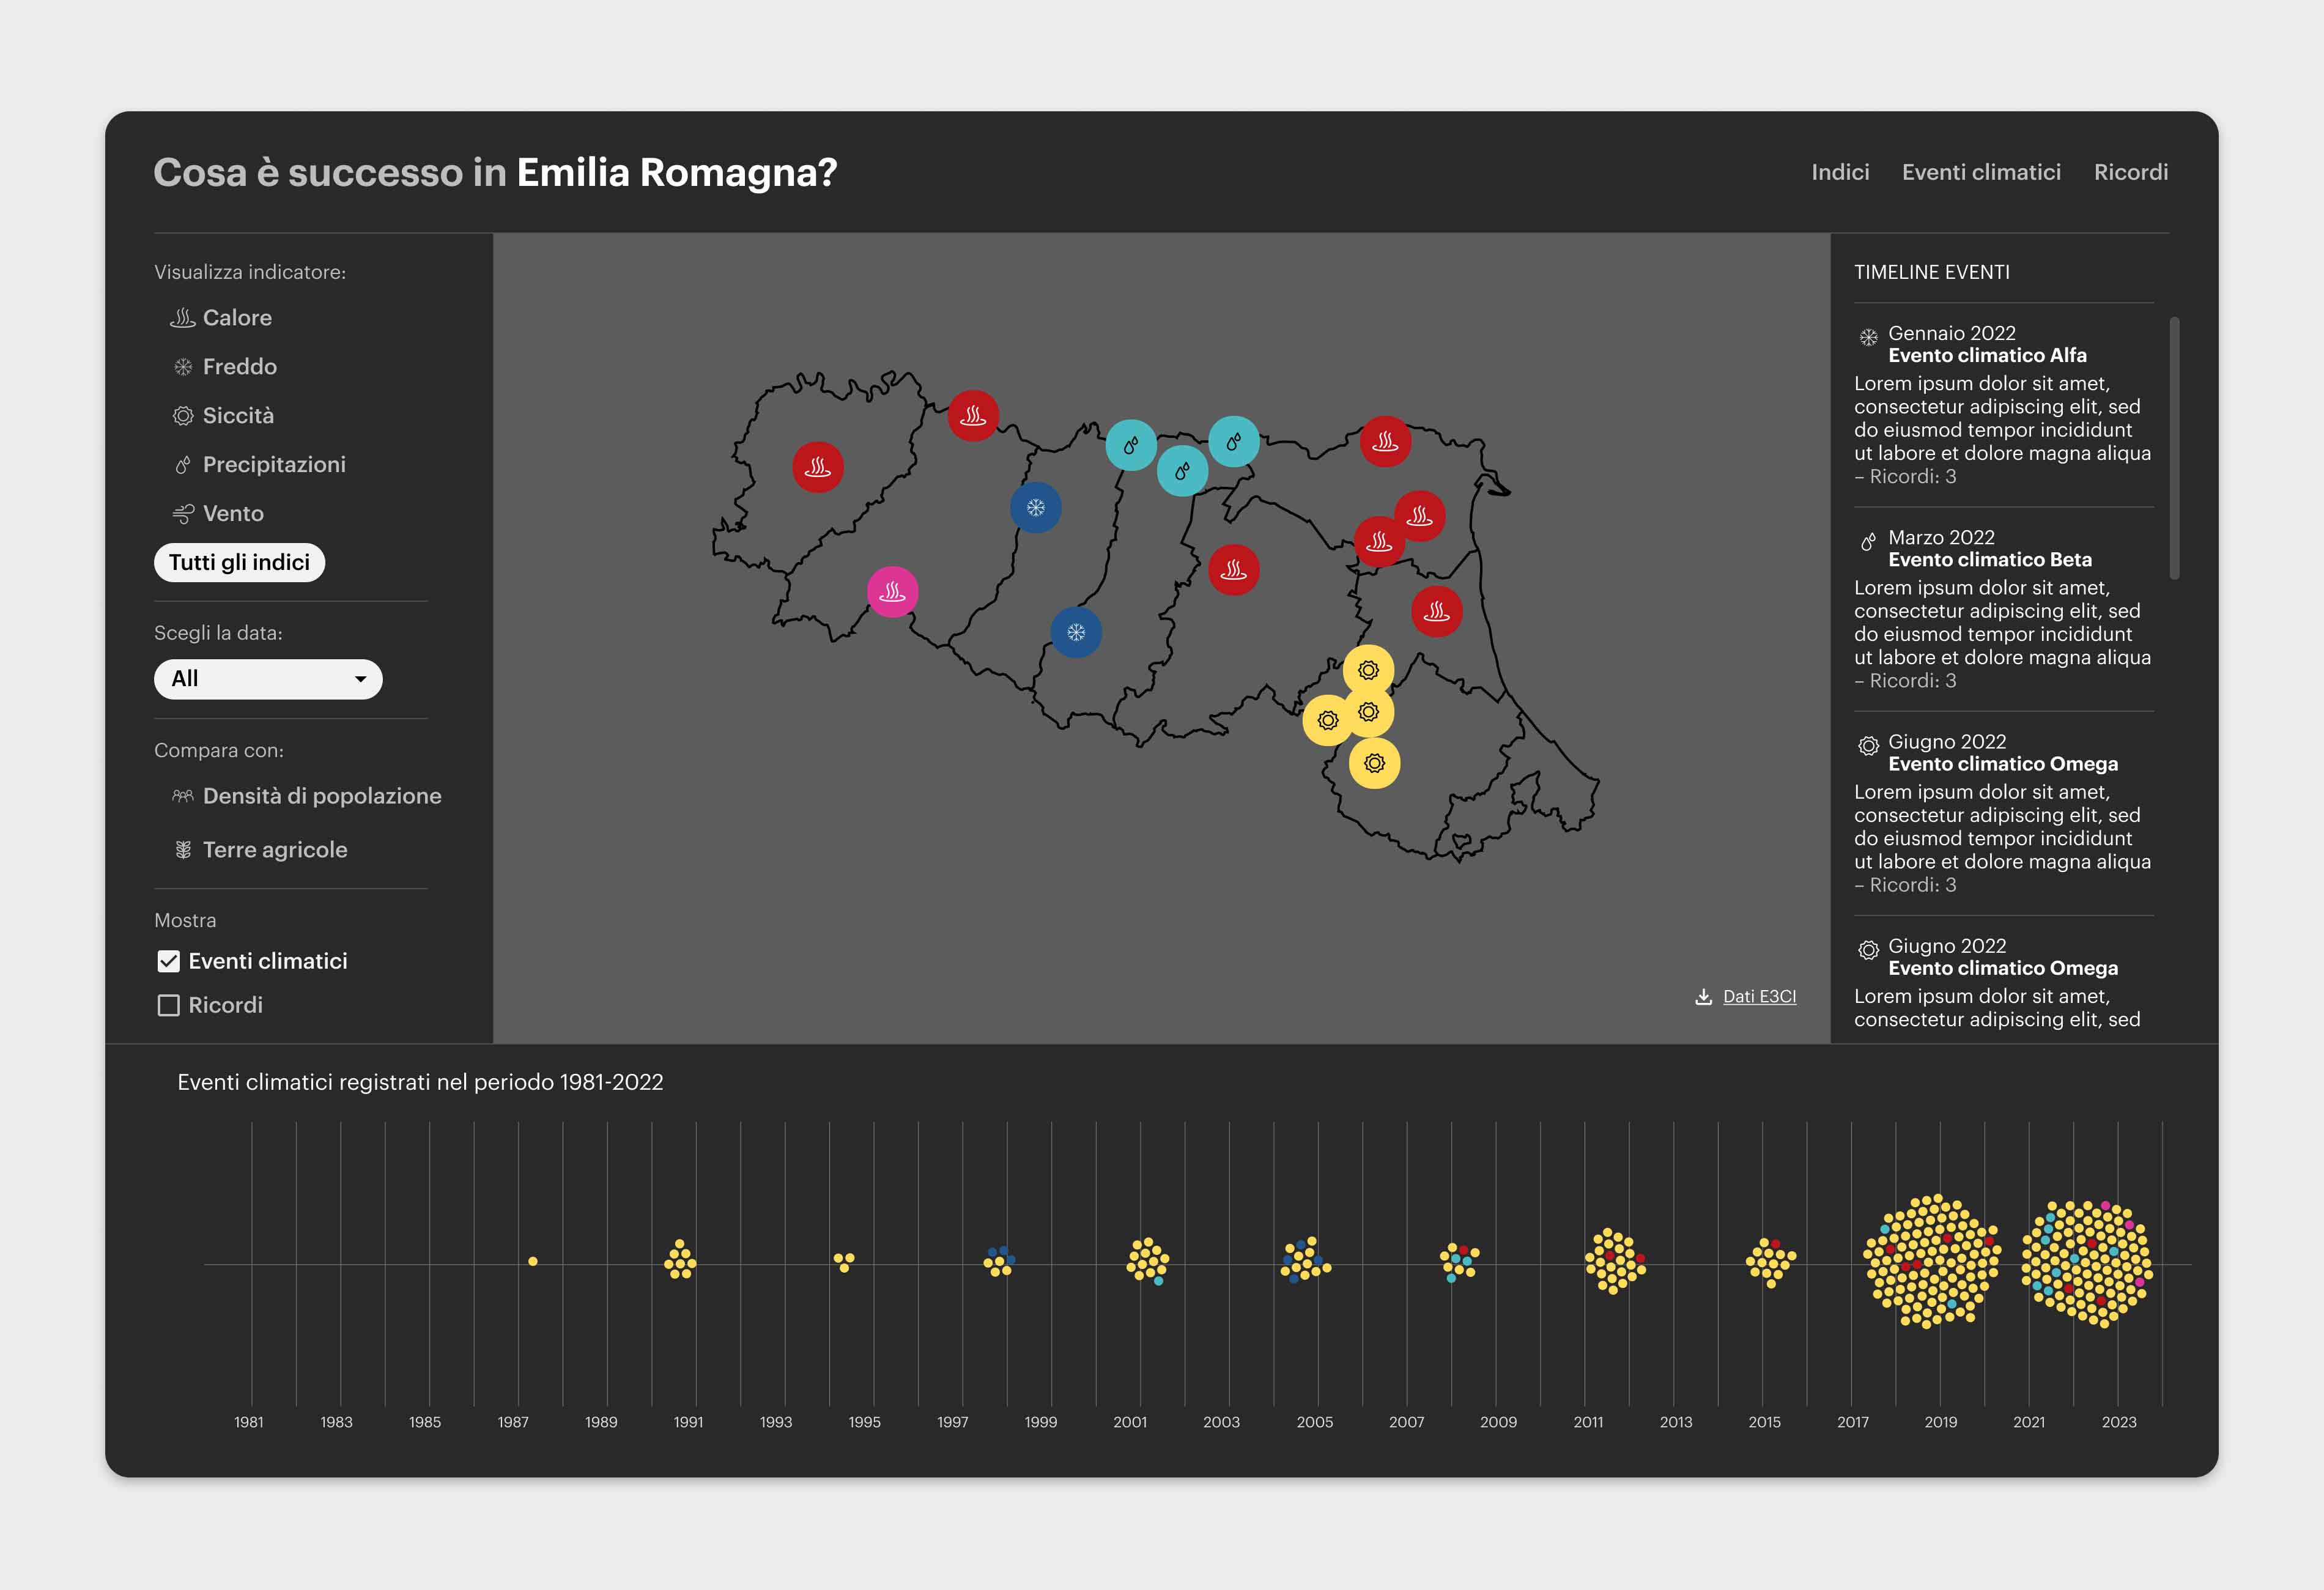
Users can also use the platform as an historical database of extreme climate events: each event is geolocated on the map and plotted on a Beeswarm chart below to show the trend over time.
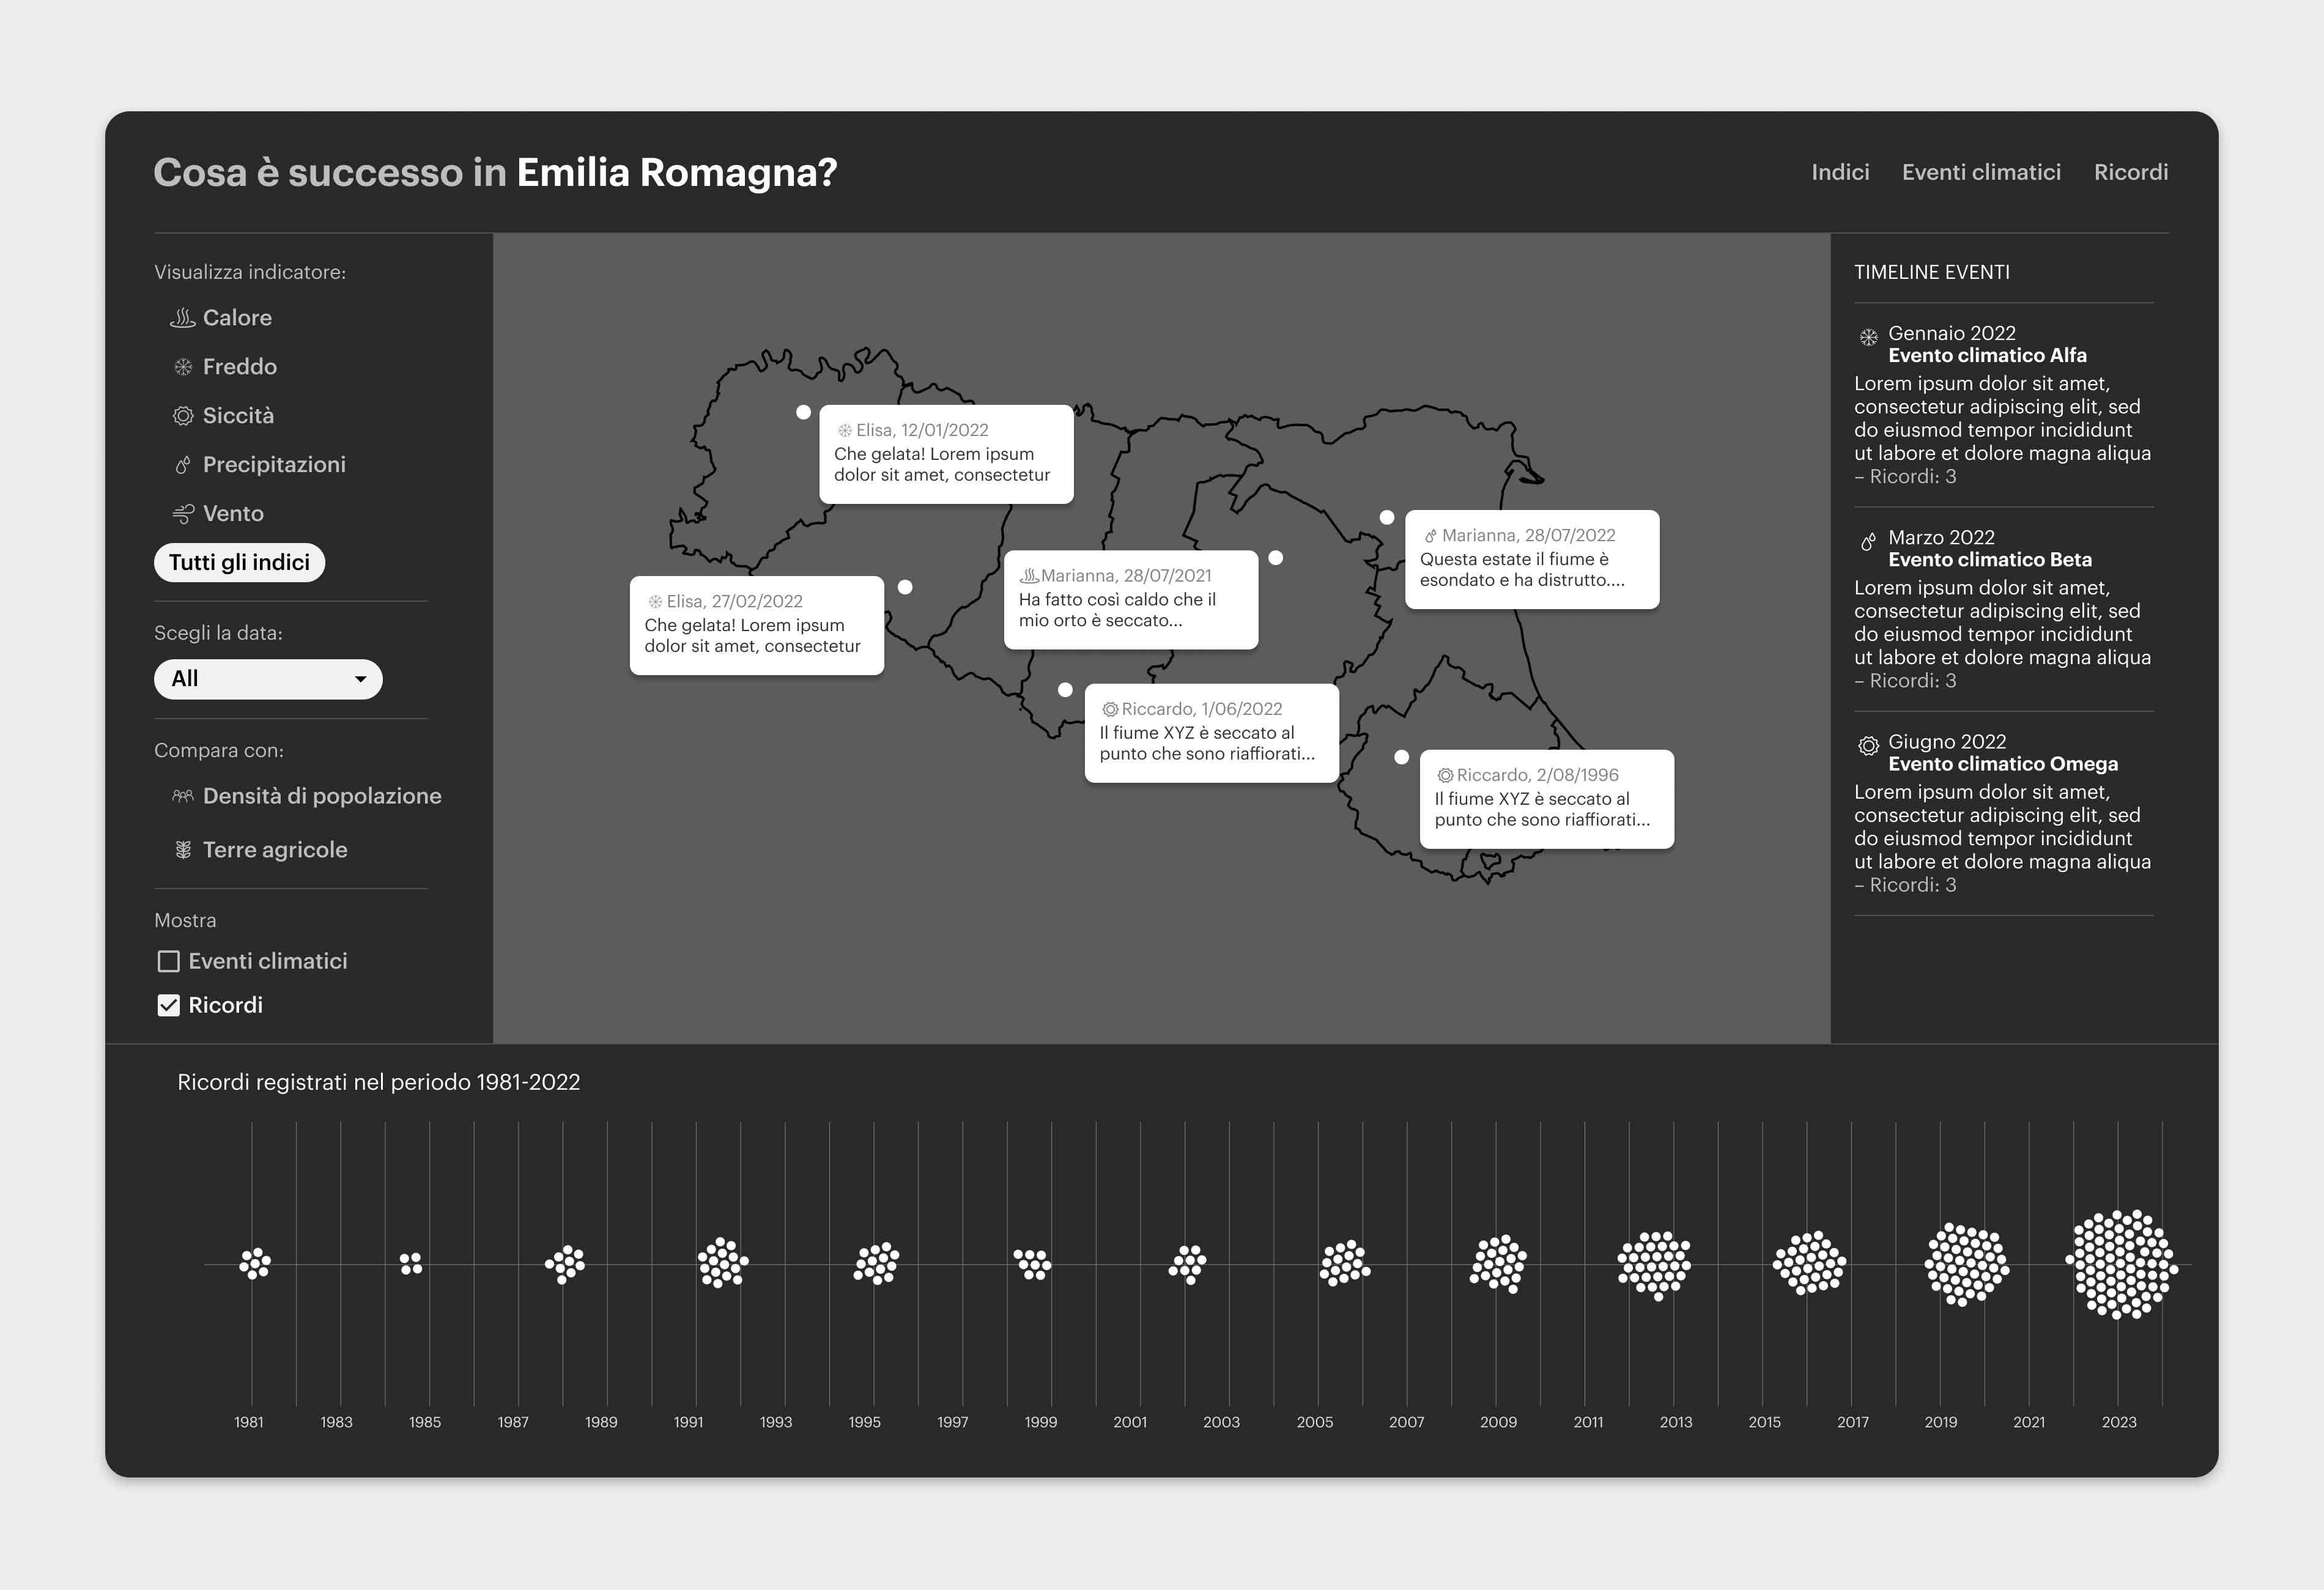
The platform allows users to share their personal experiences of extreme weather events. These memories provide a personal connection to the event, which can increase awareness of the impact of climate change on individuals and local communities. Additionally, these memories can be used by researchers to validate the accuracy of extreme weather indices and to gain a better understanding of the human experience of severe weather.
The project was realised during a 24-hour hackathon held in Bologna, at the Unipol Tower, on the
17-18 January 2023 (we won the 3rd place). The event was organised by International Foundation Big
Data and Artificial Intelligence for Human Development (IFAB), Leithà S.r.l., and Fondazione Centro
Euro - Mediterraneo sui Cambiamenti Climatici (CMCC).
Authors
Federica Guerrini / Climate
Data Scientist
Cinzia Bongino / Graphic, Information and Web Designer
We are happy to get in touch if you are interested in developing this concept further on.
Year
2023