AI-generated report design
Vantis Decision Intelligence produces structured cybersecurity strategy assessments for senior
security leaders. Every organisation that chooses Vantis receives a 30-page assessment
report, that will use to make
investment and prioritisation decisions.
The report is generated by an AI system that produces structured narrative, data outputs, and
evidence-grounded findings specific to each organisation. Taking into account the plurality of data and
information, as well as different years of analysis, the design had to be defined by rules that
produce correct output regardless of content variability.
Report cover
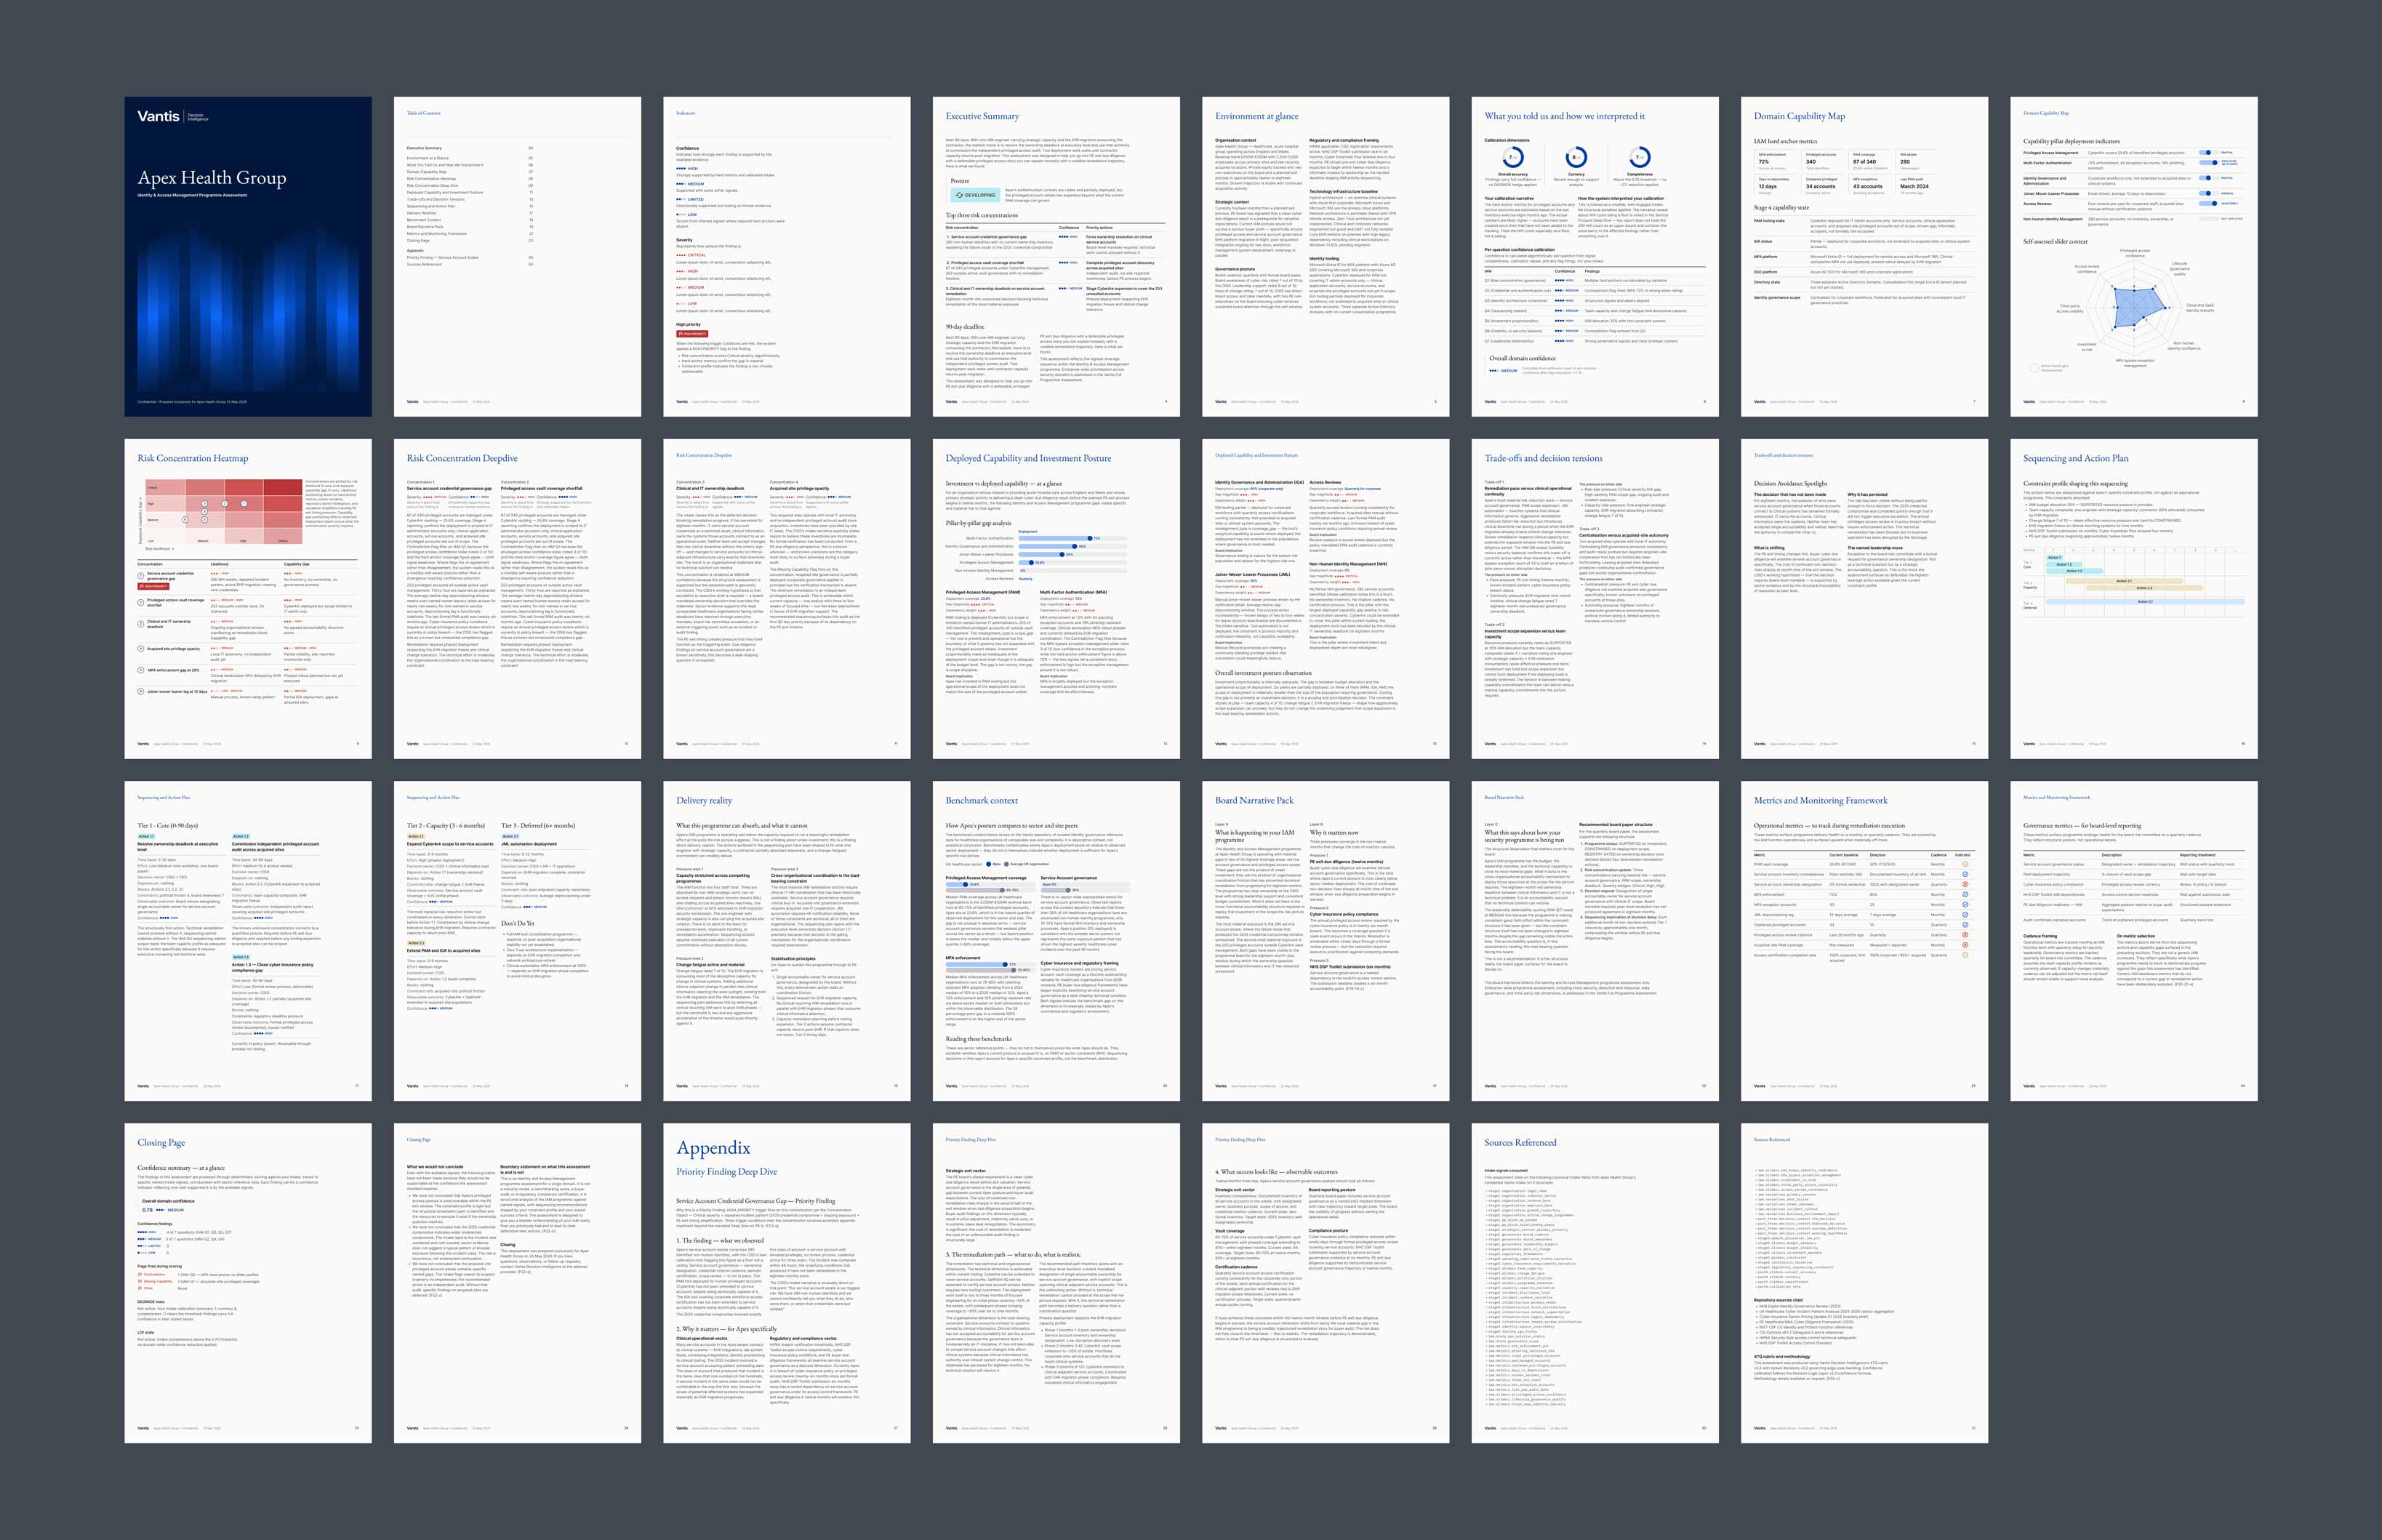
30-page report
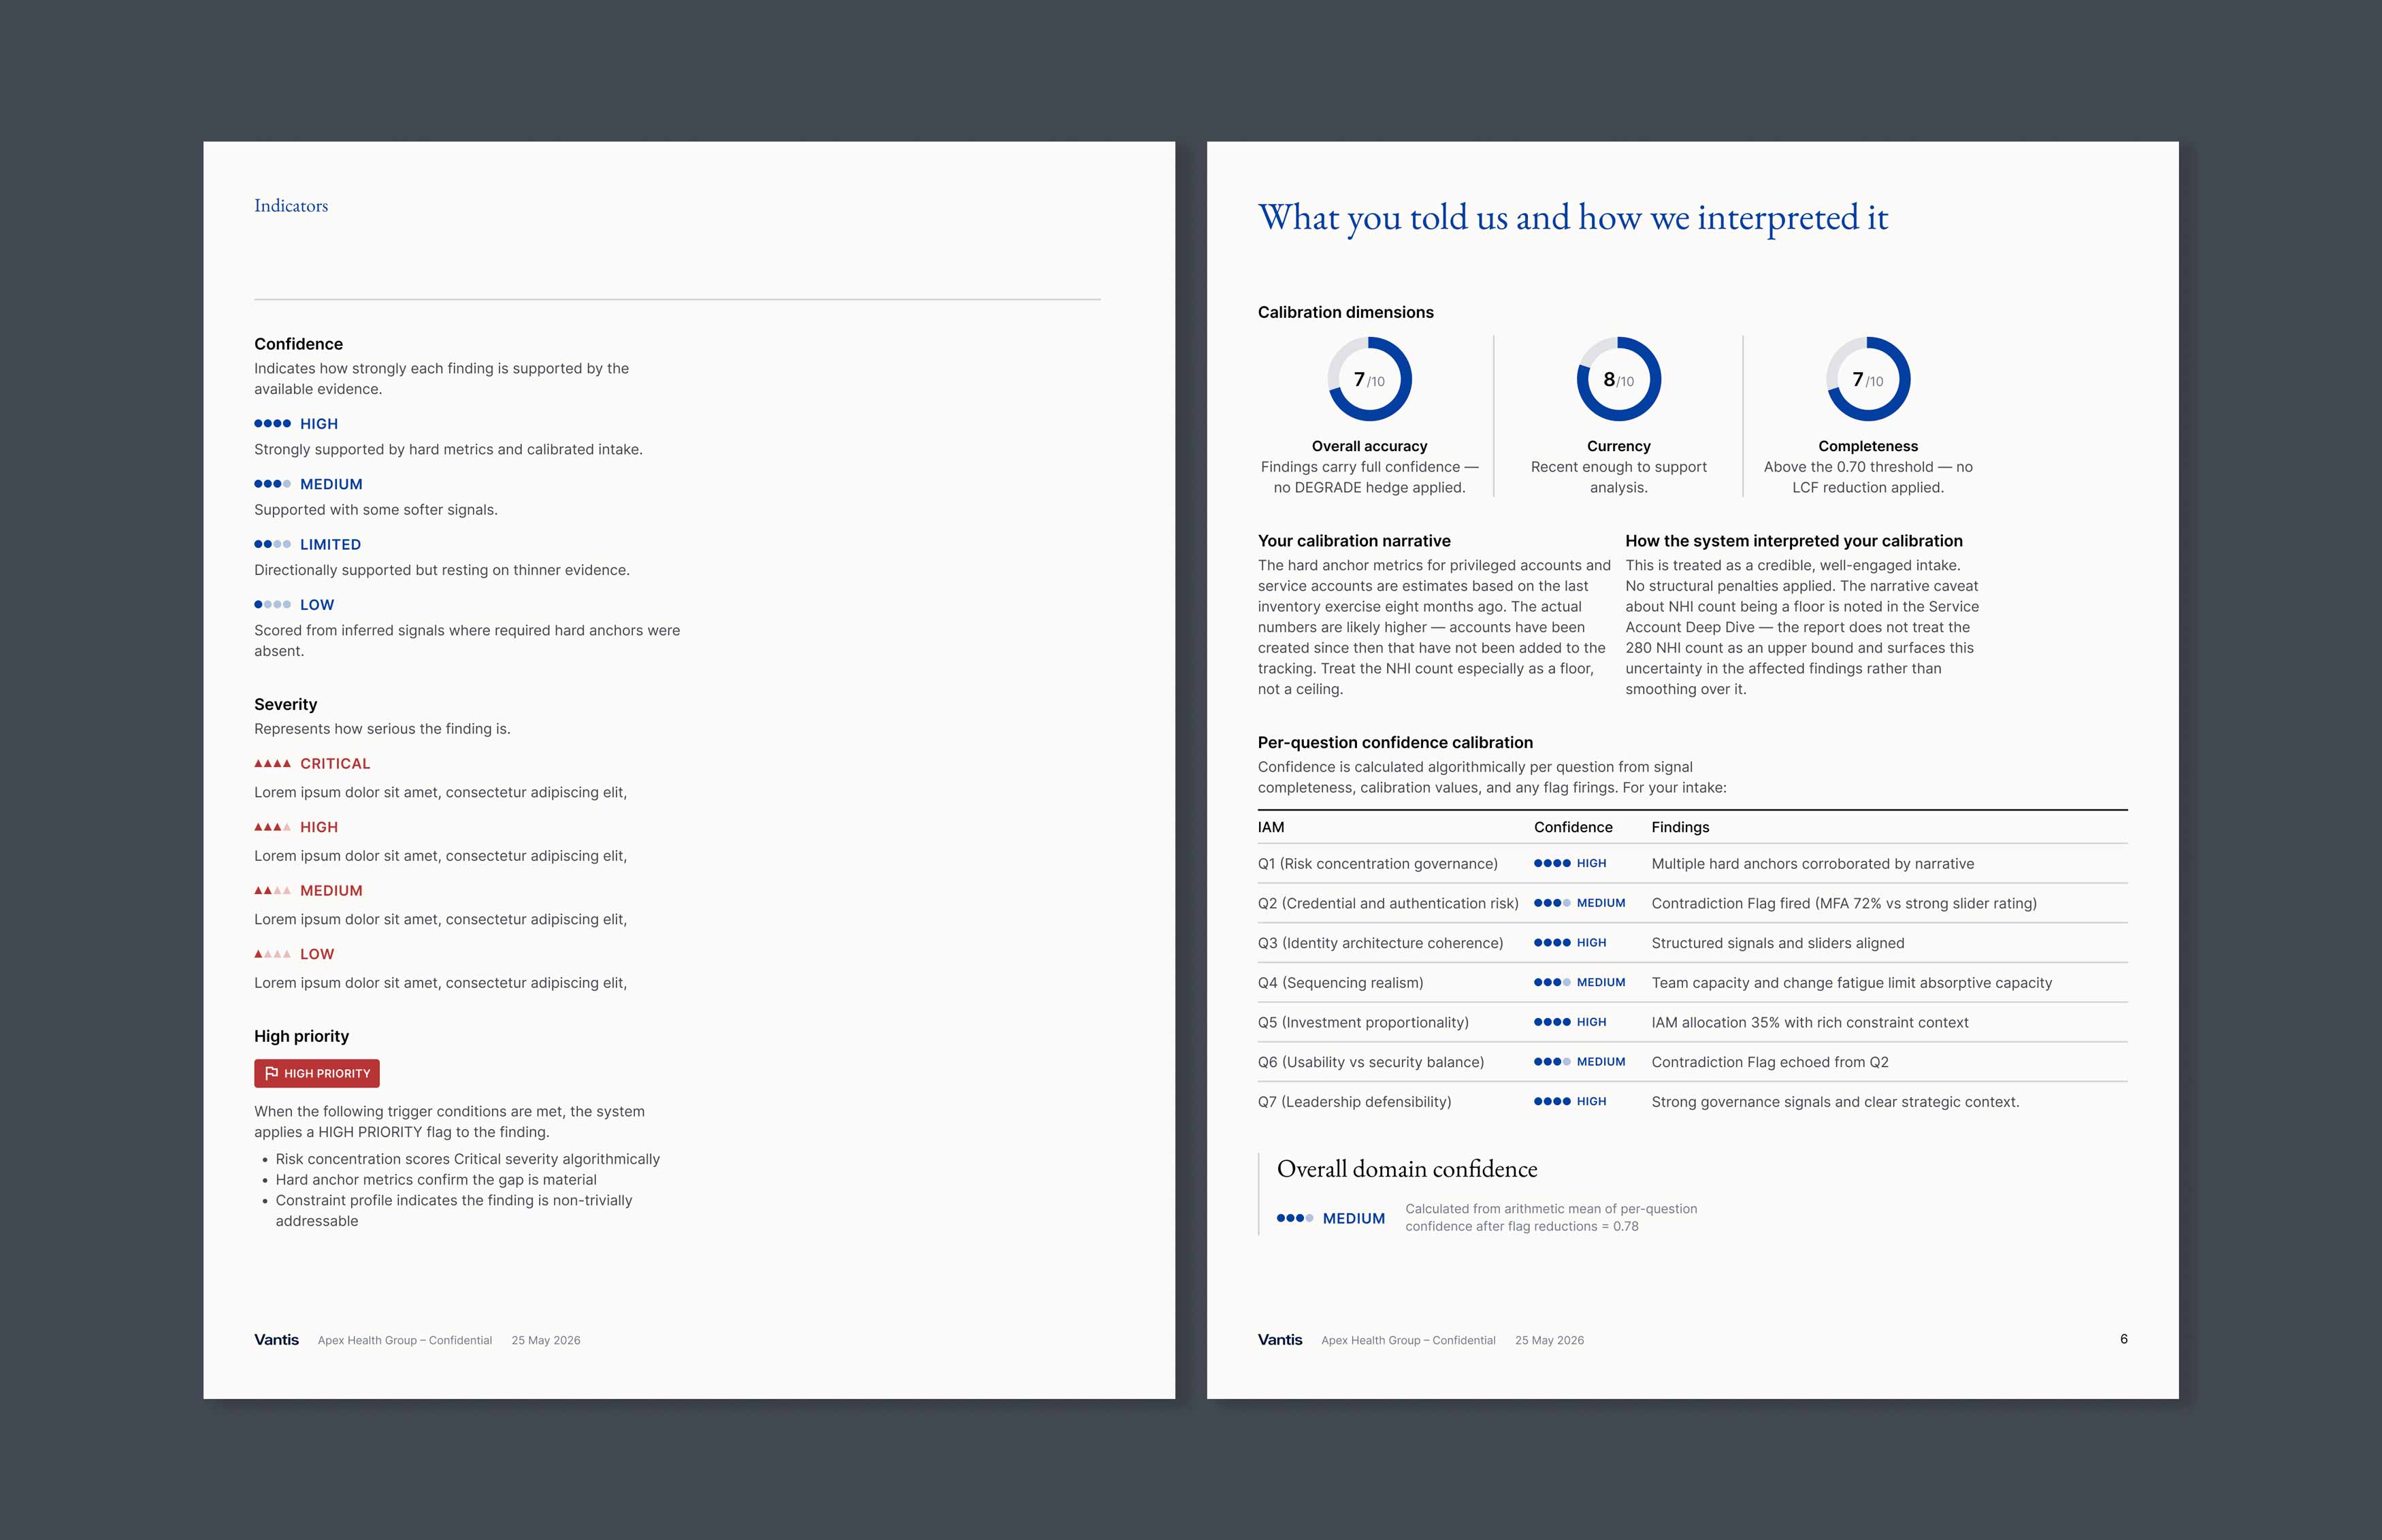
Legend and one of the first report pages where the assessment method is introduced.
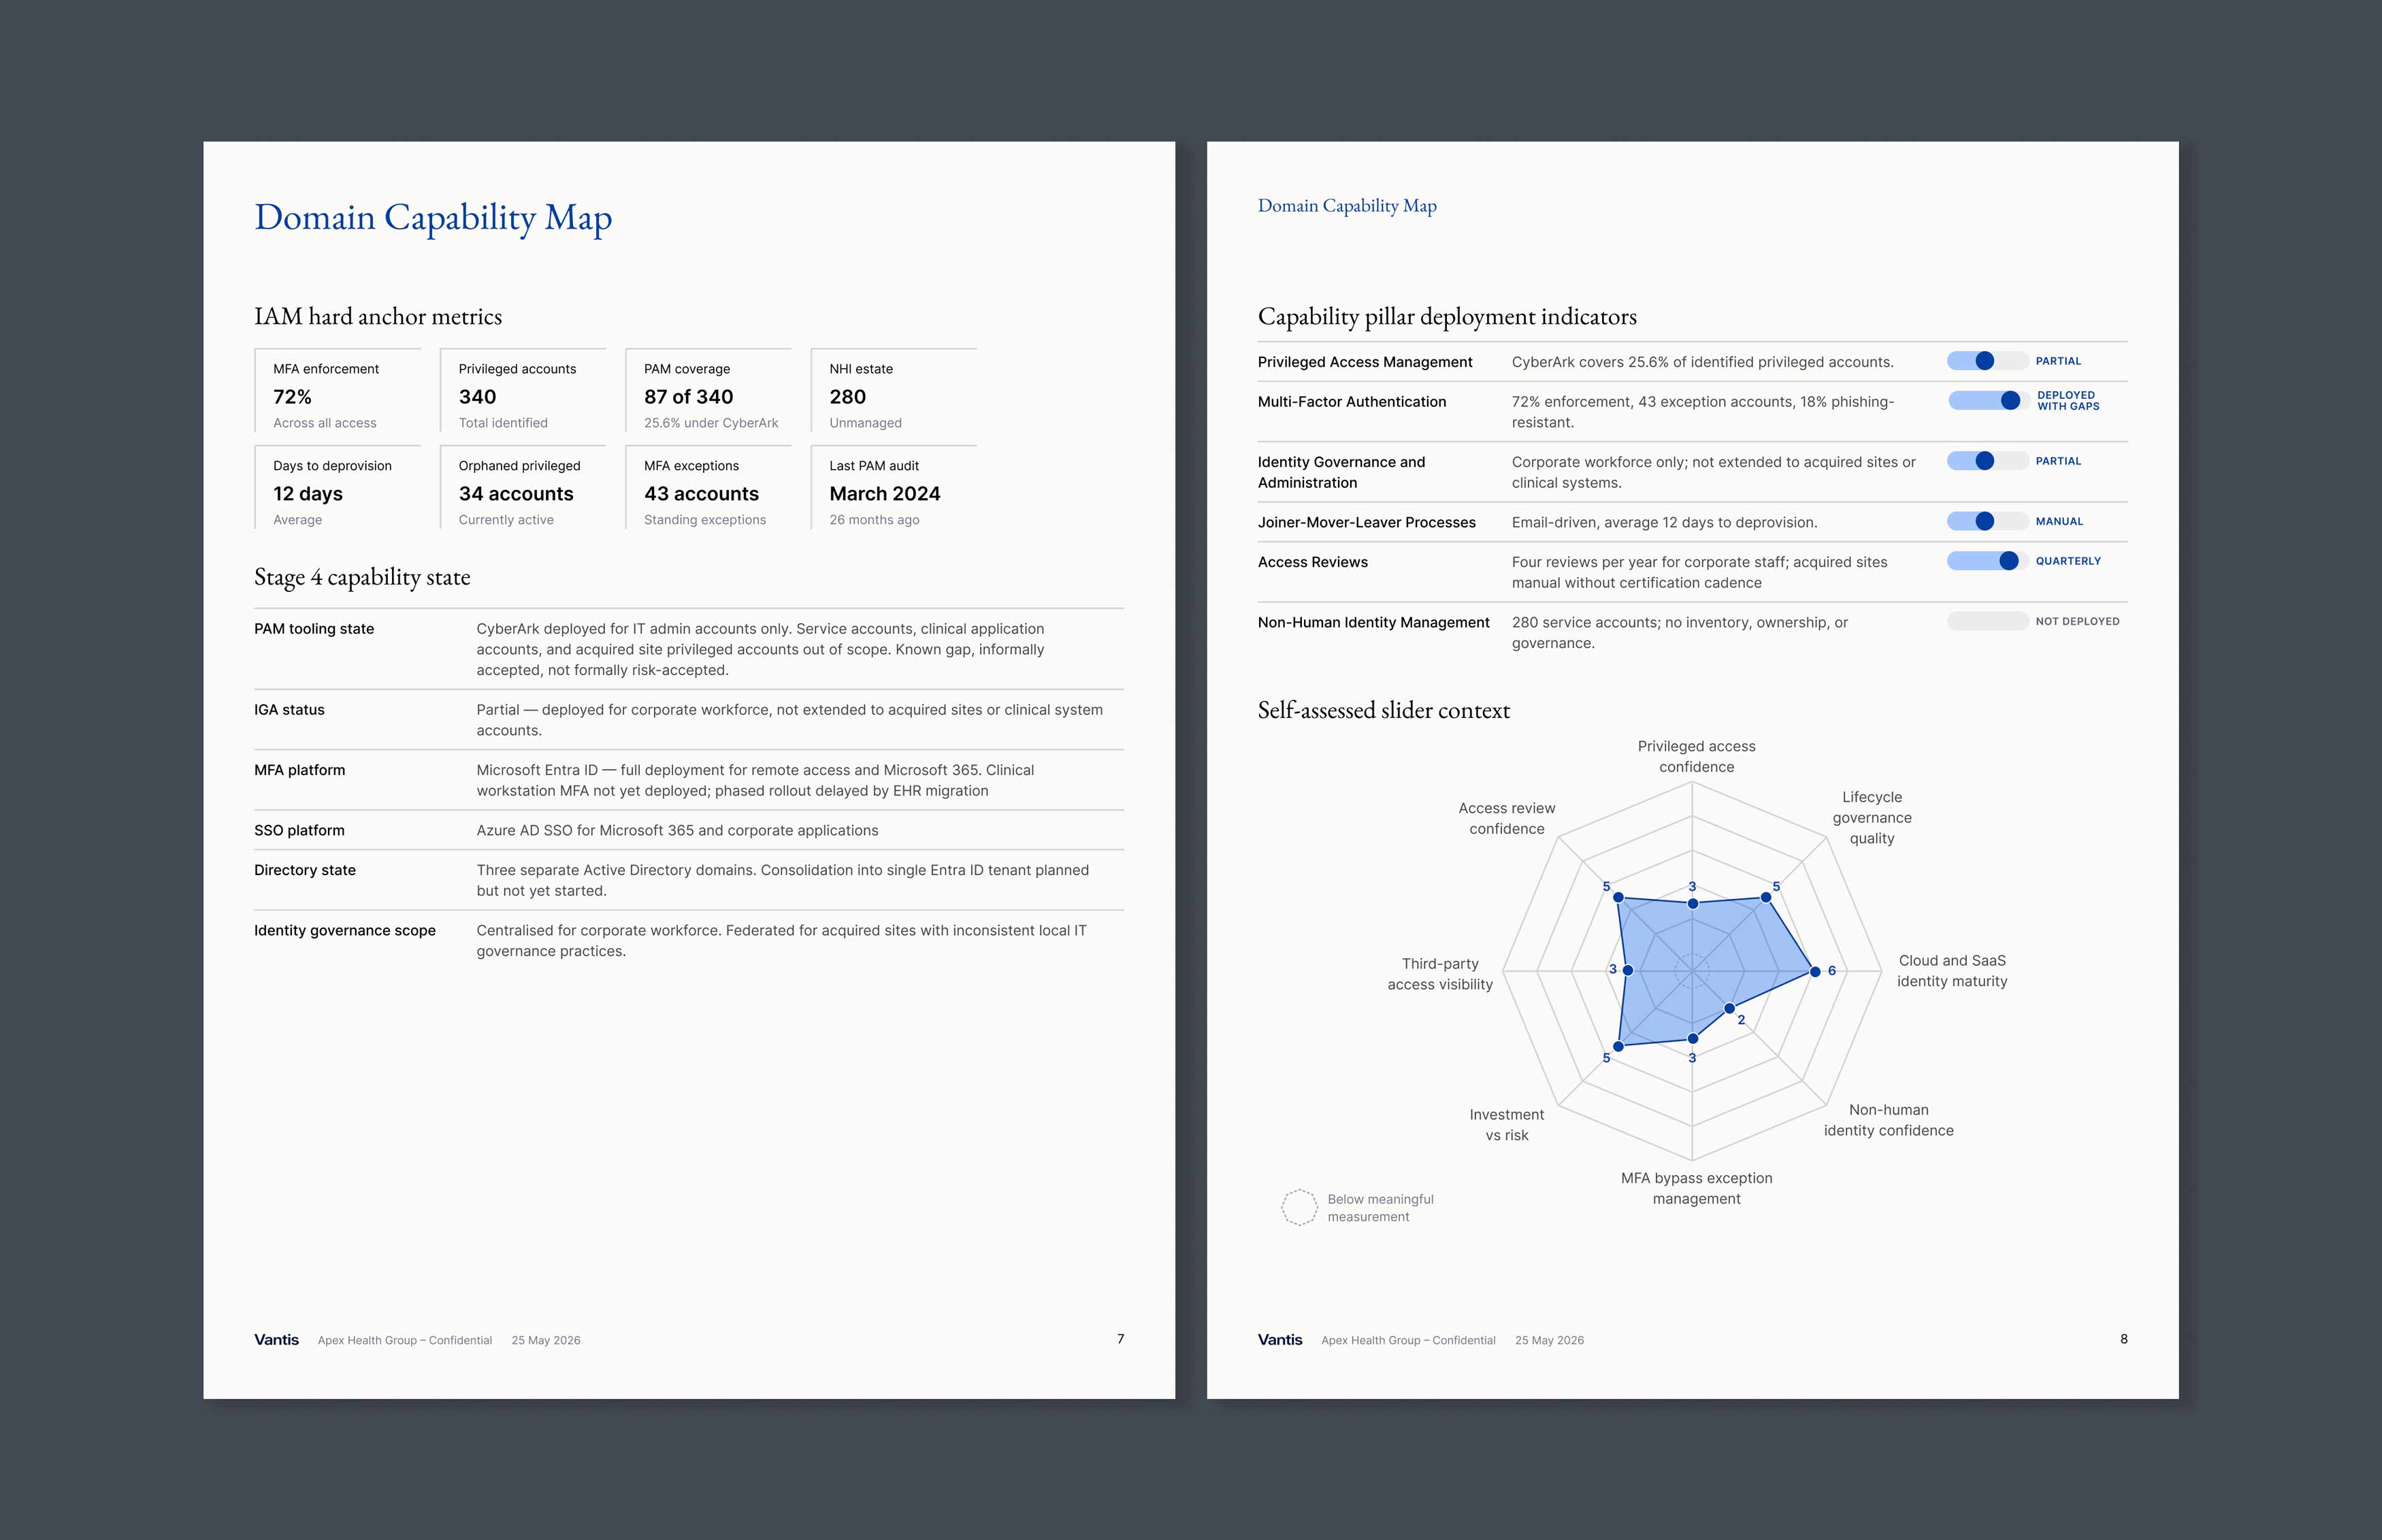
Domain capability map, with a radar chart that presents the evalutation combined by the deployment indicators.
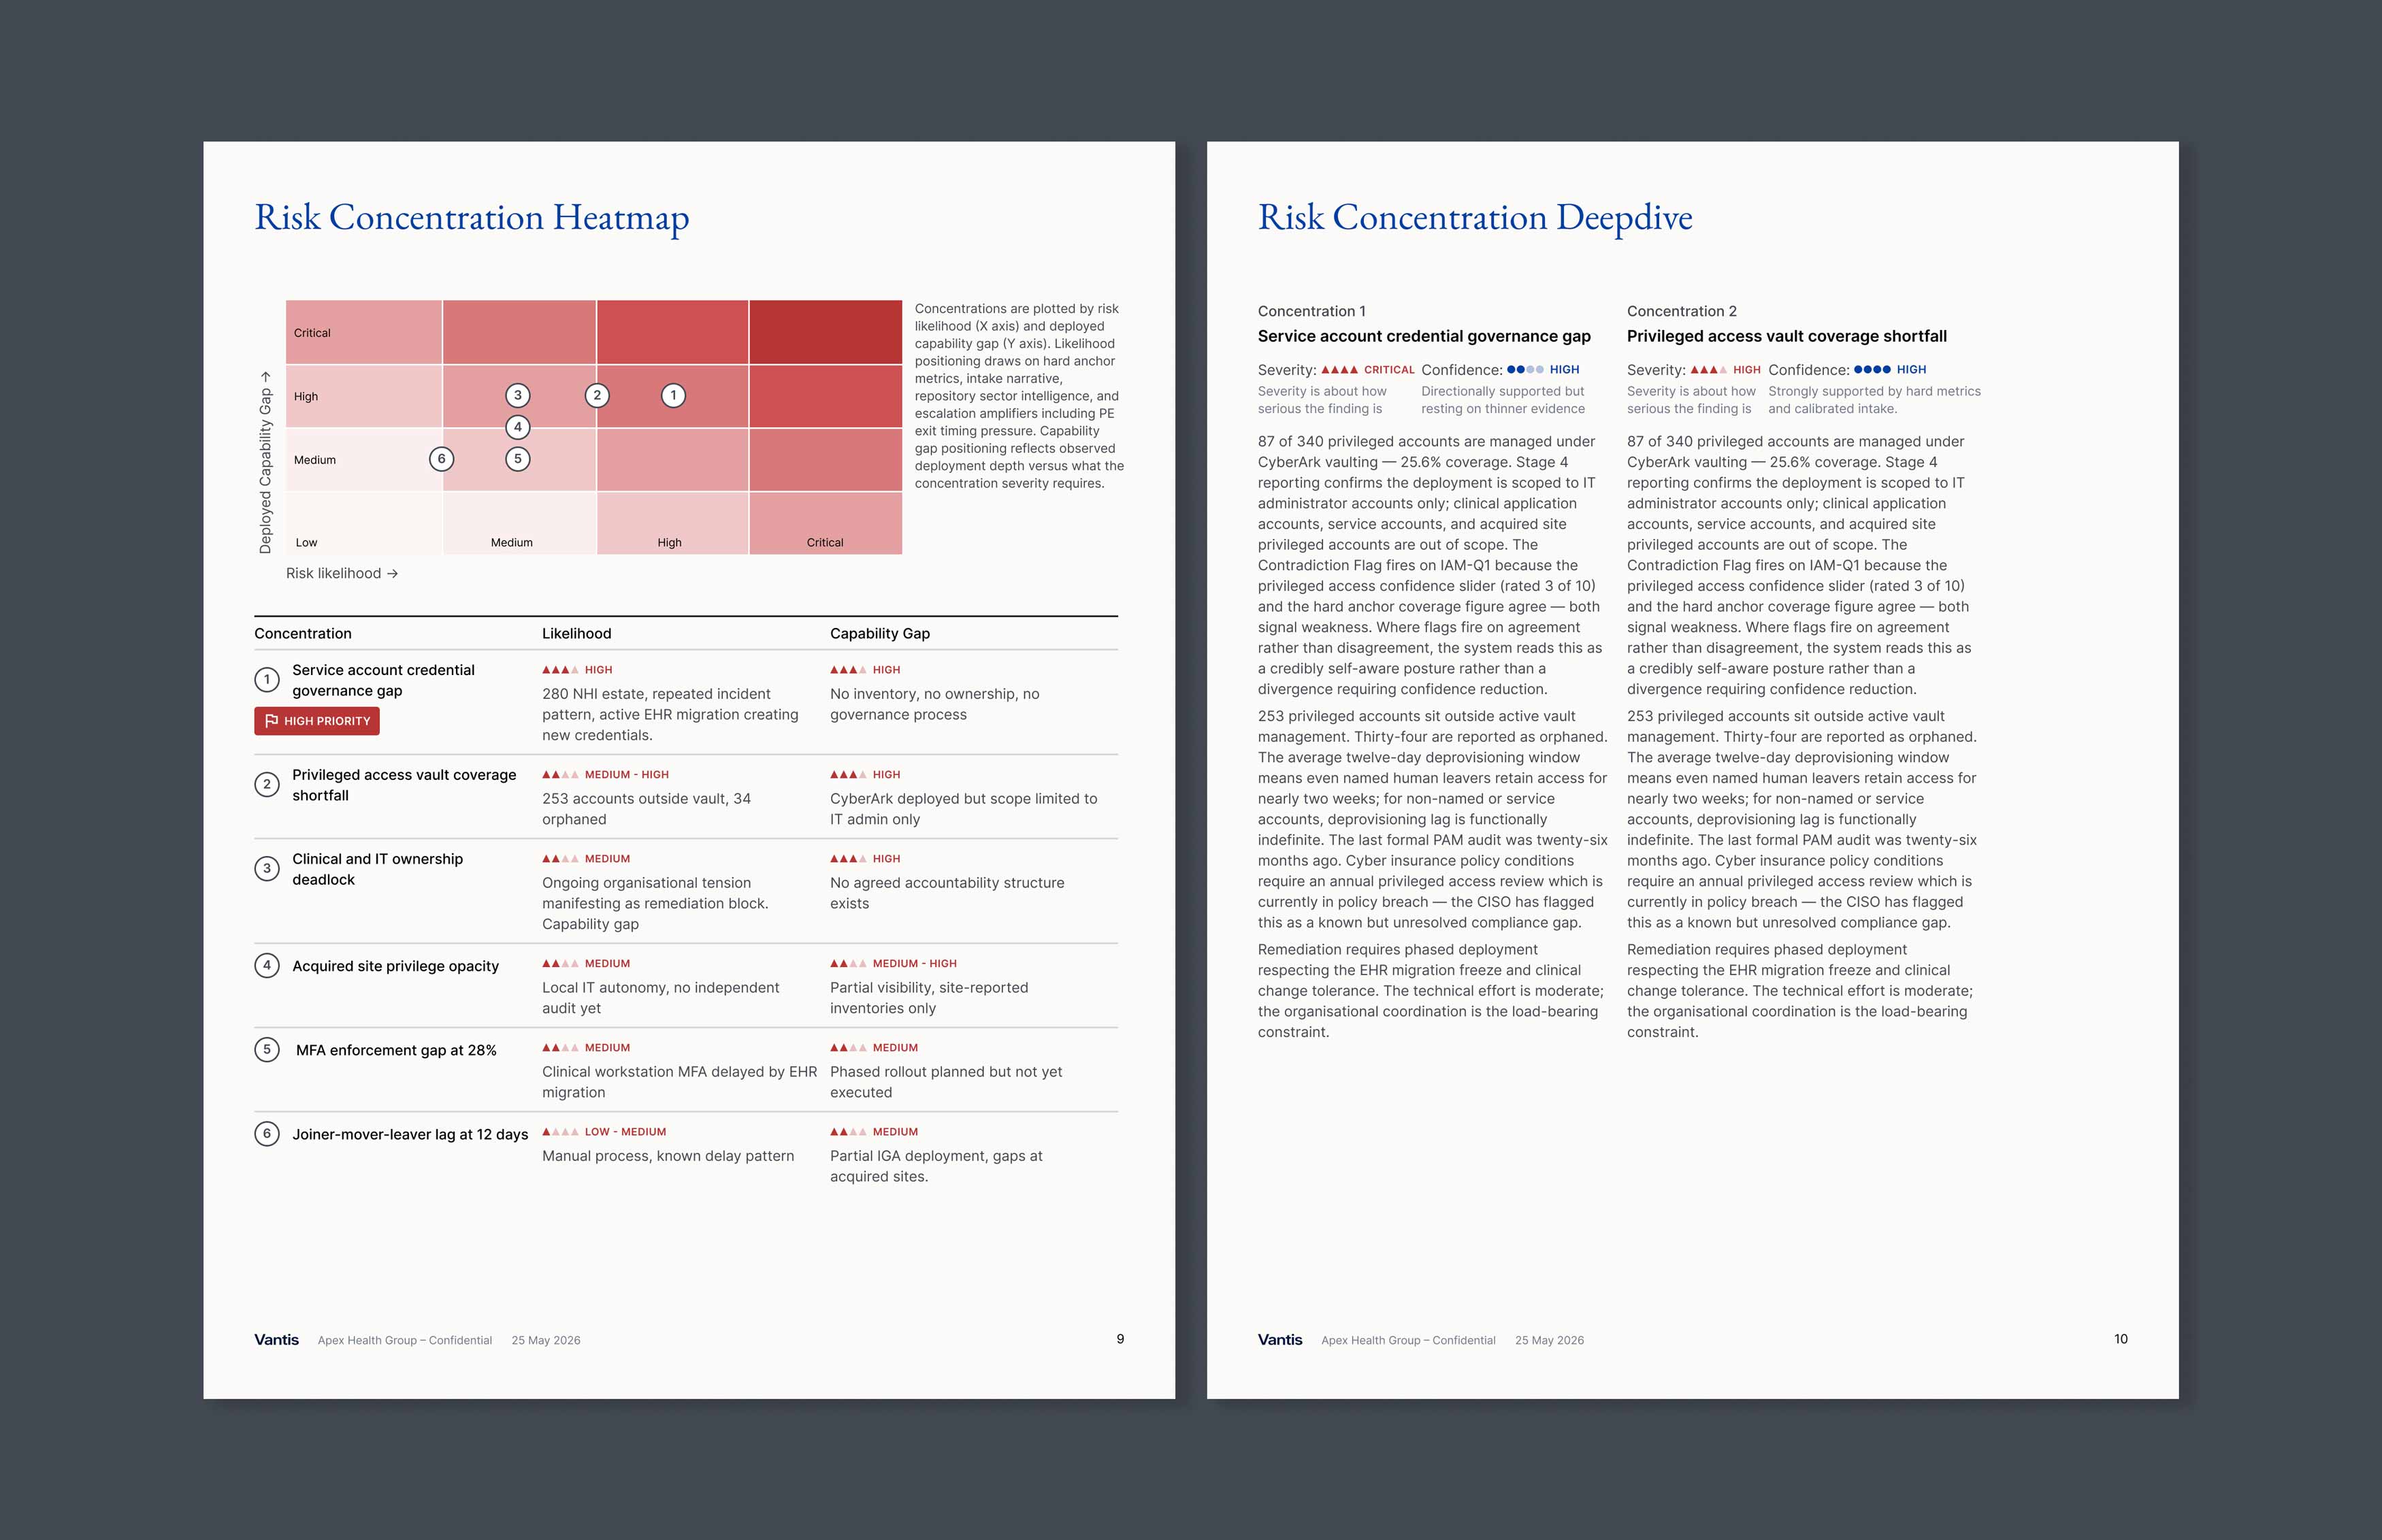
The risk concentration chapter combines a table and a heatmap design to present risk and gap analysis of the organisation.
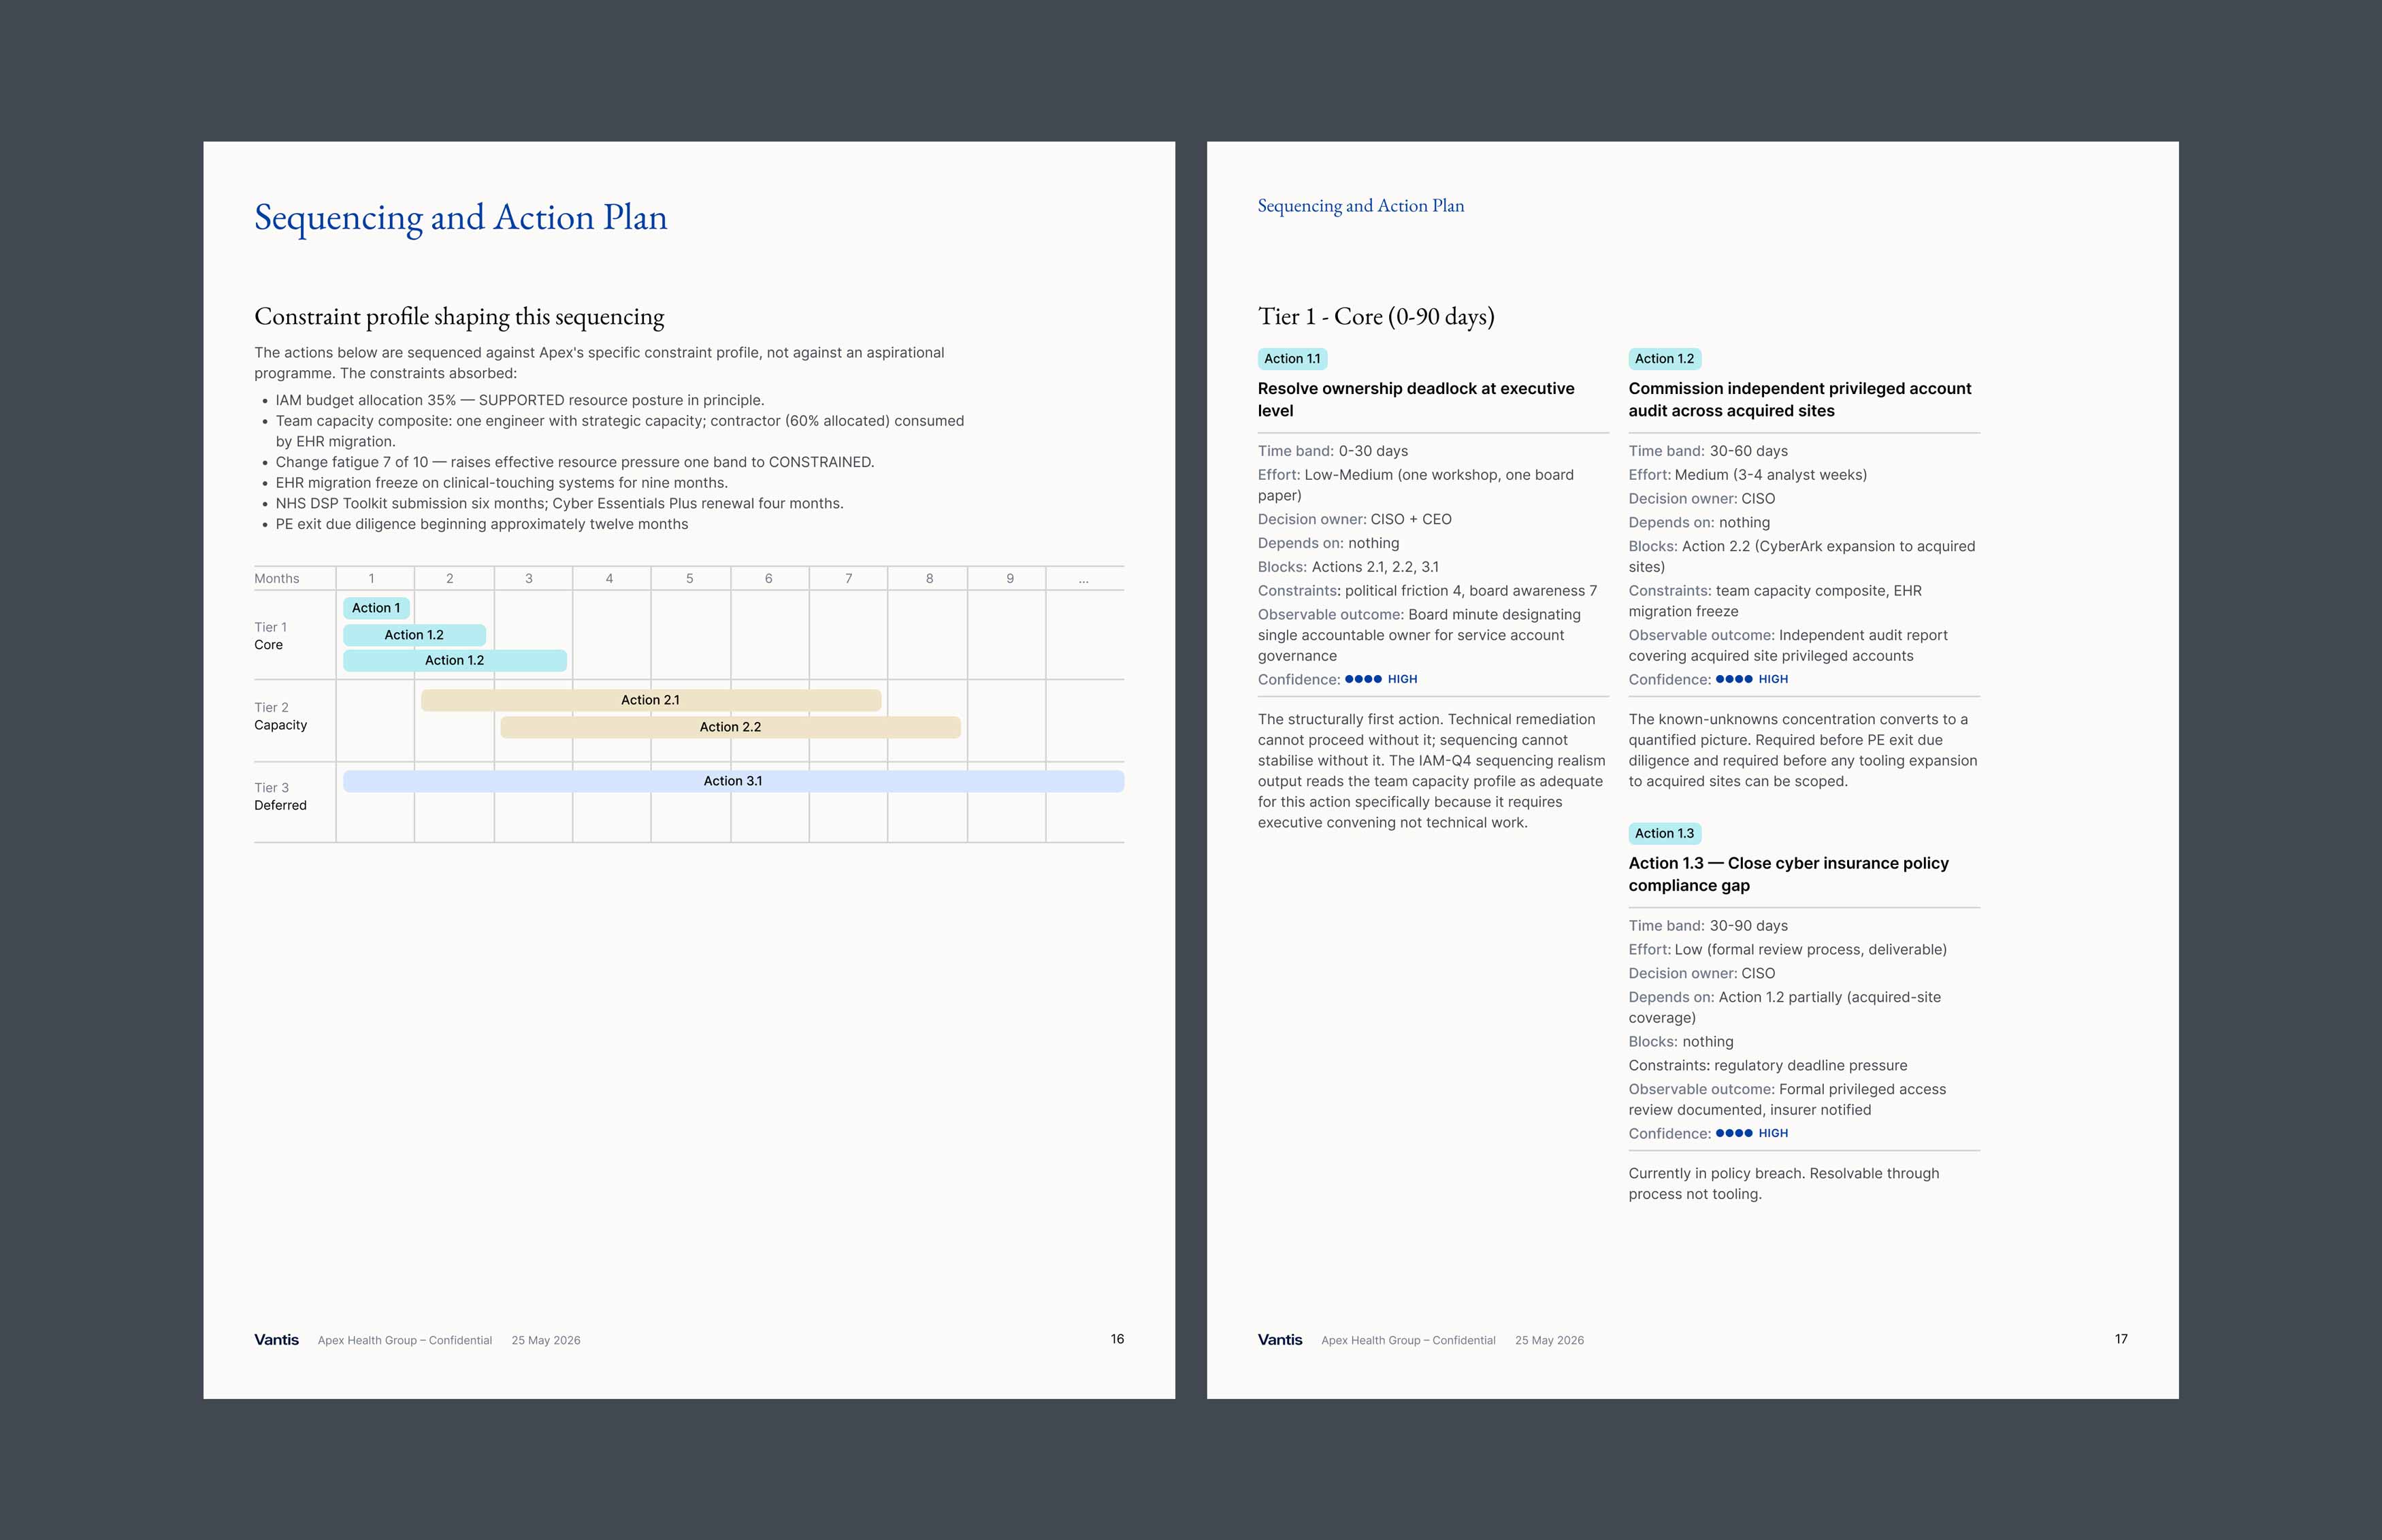
A gantt chart organises the main actions the organisation should take based on the outcome of the assessment.
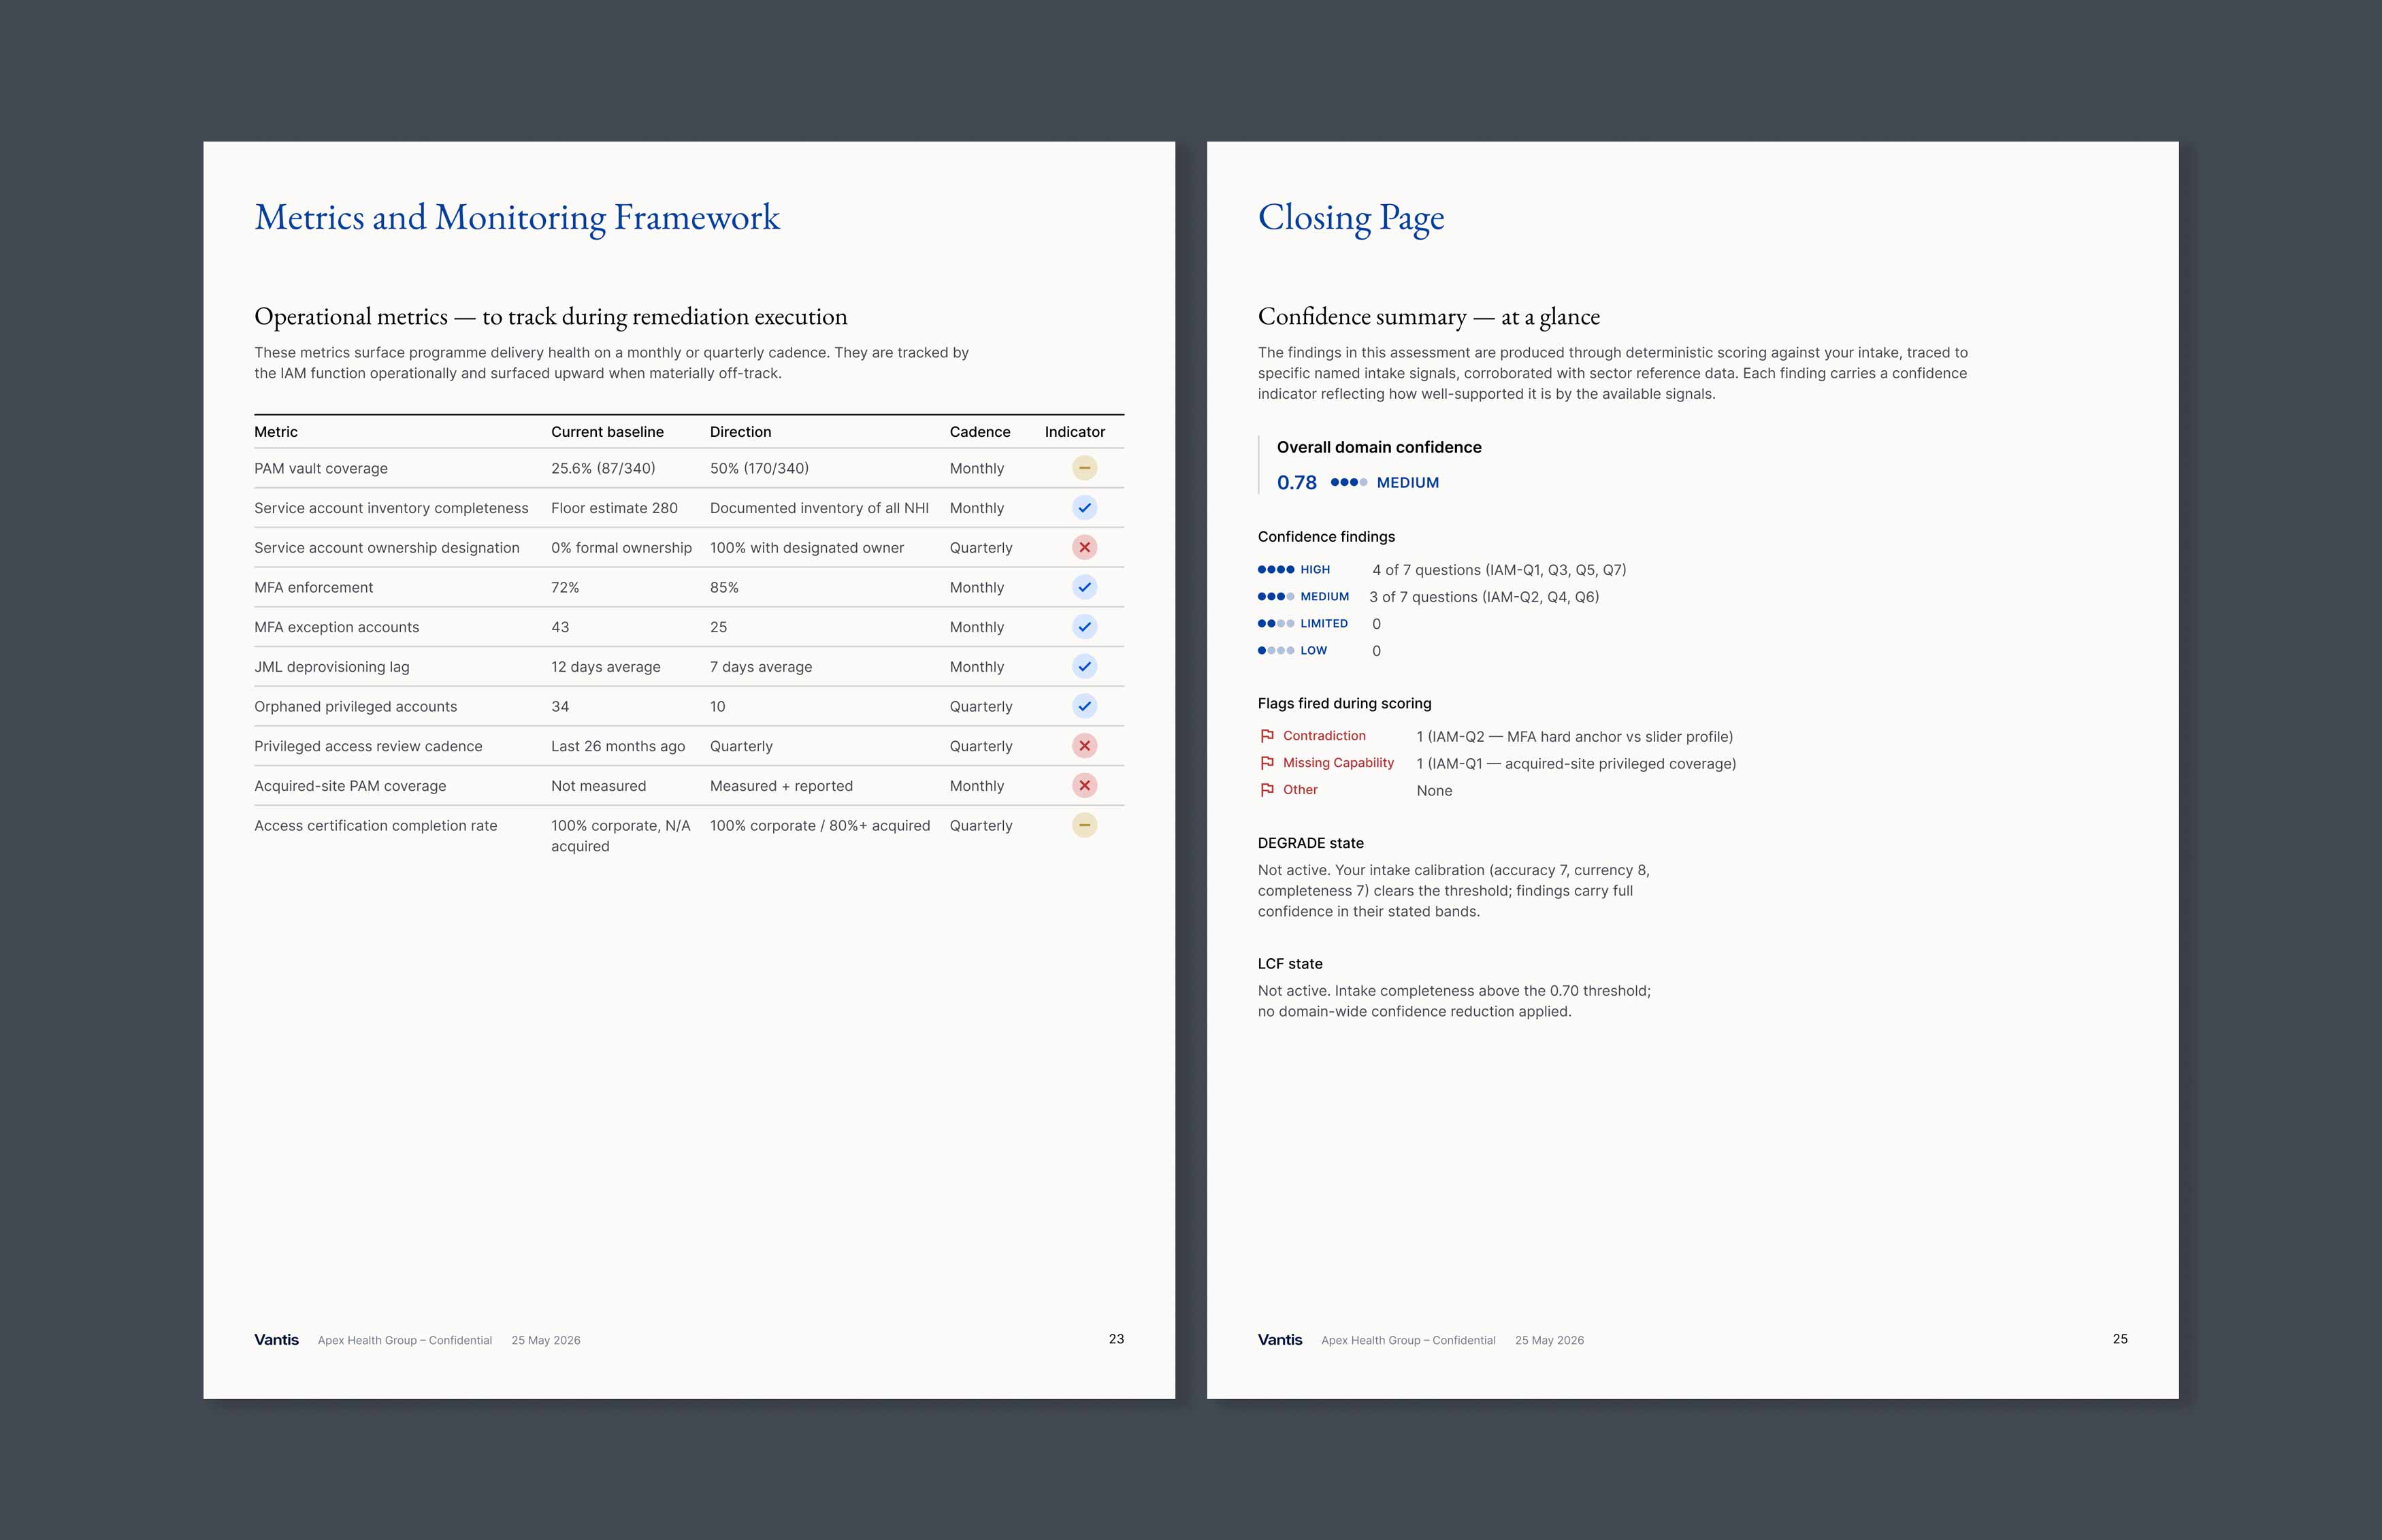
The monitoring framework lists additional metrics to measure during the remediation execution.
Considering that many elements in the report render conditionally — they appear only when specific data conditions
are met, the whole project has been treated like a UX/UI design project. Titles, paragraphs, sources, captions, charts, tables, and indicators have all been treated like single components with variables.
The report layout, based on the Vantis brand identity, has been designed in Figma to facilitate the final generation via coding.
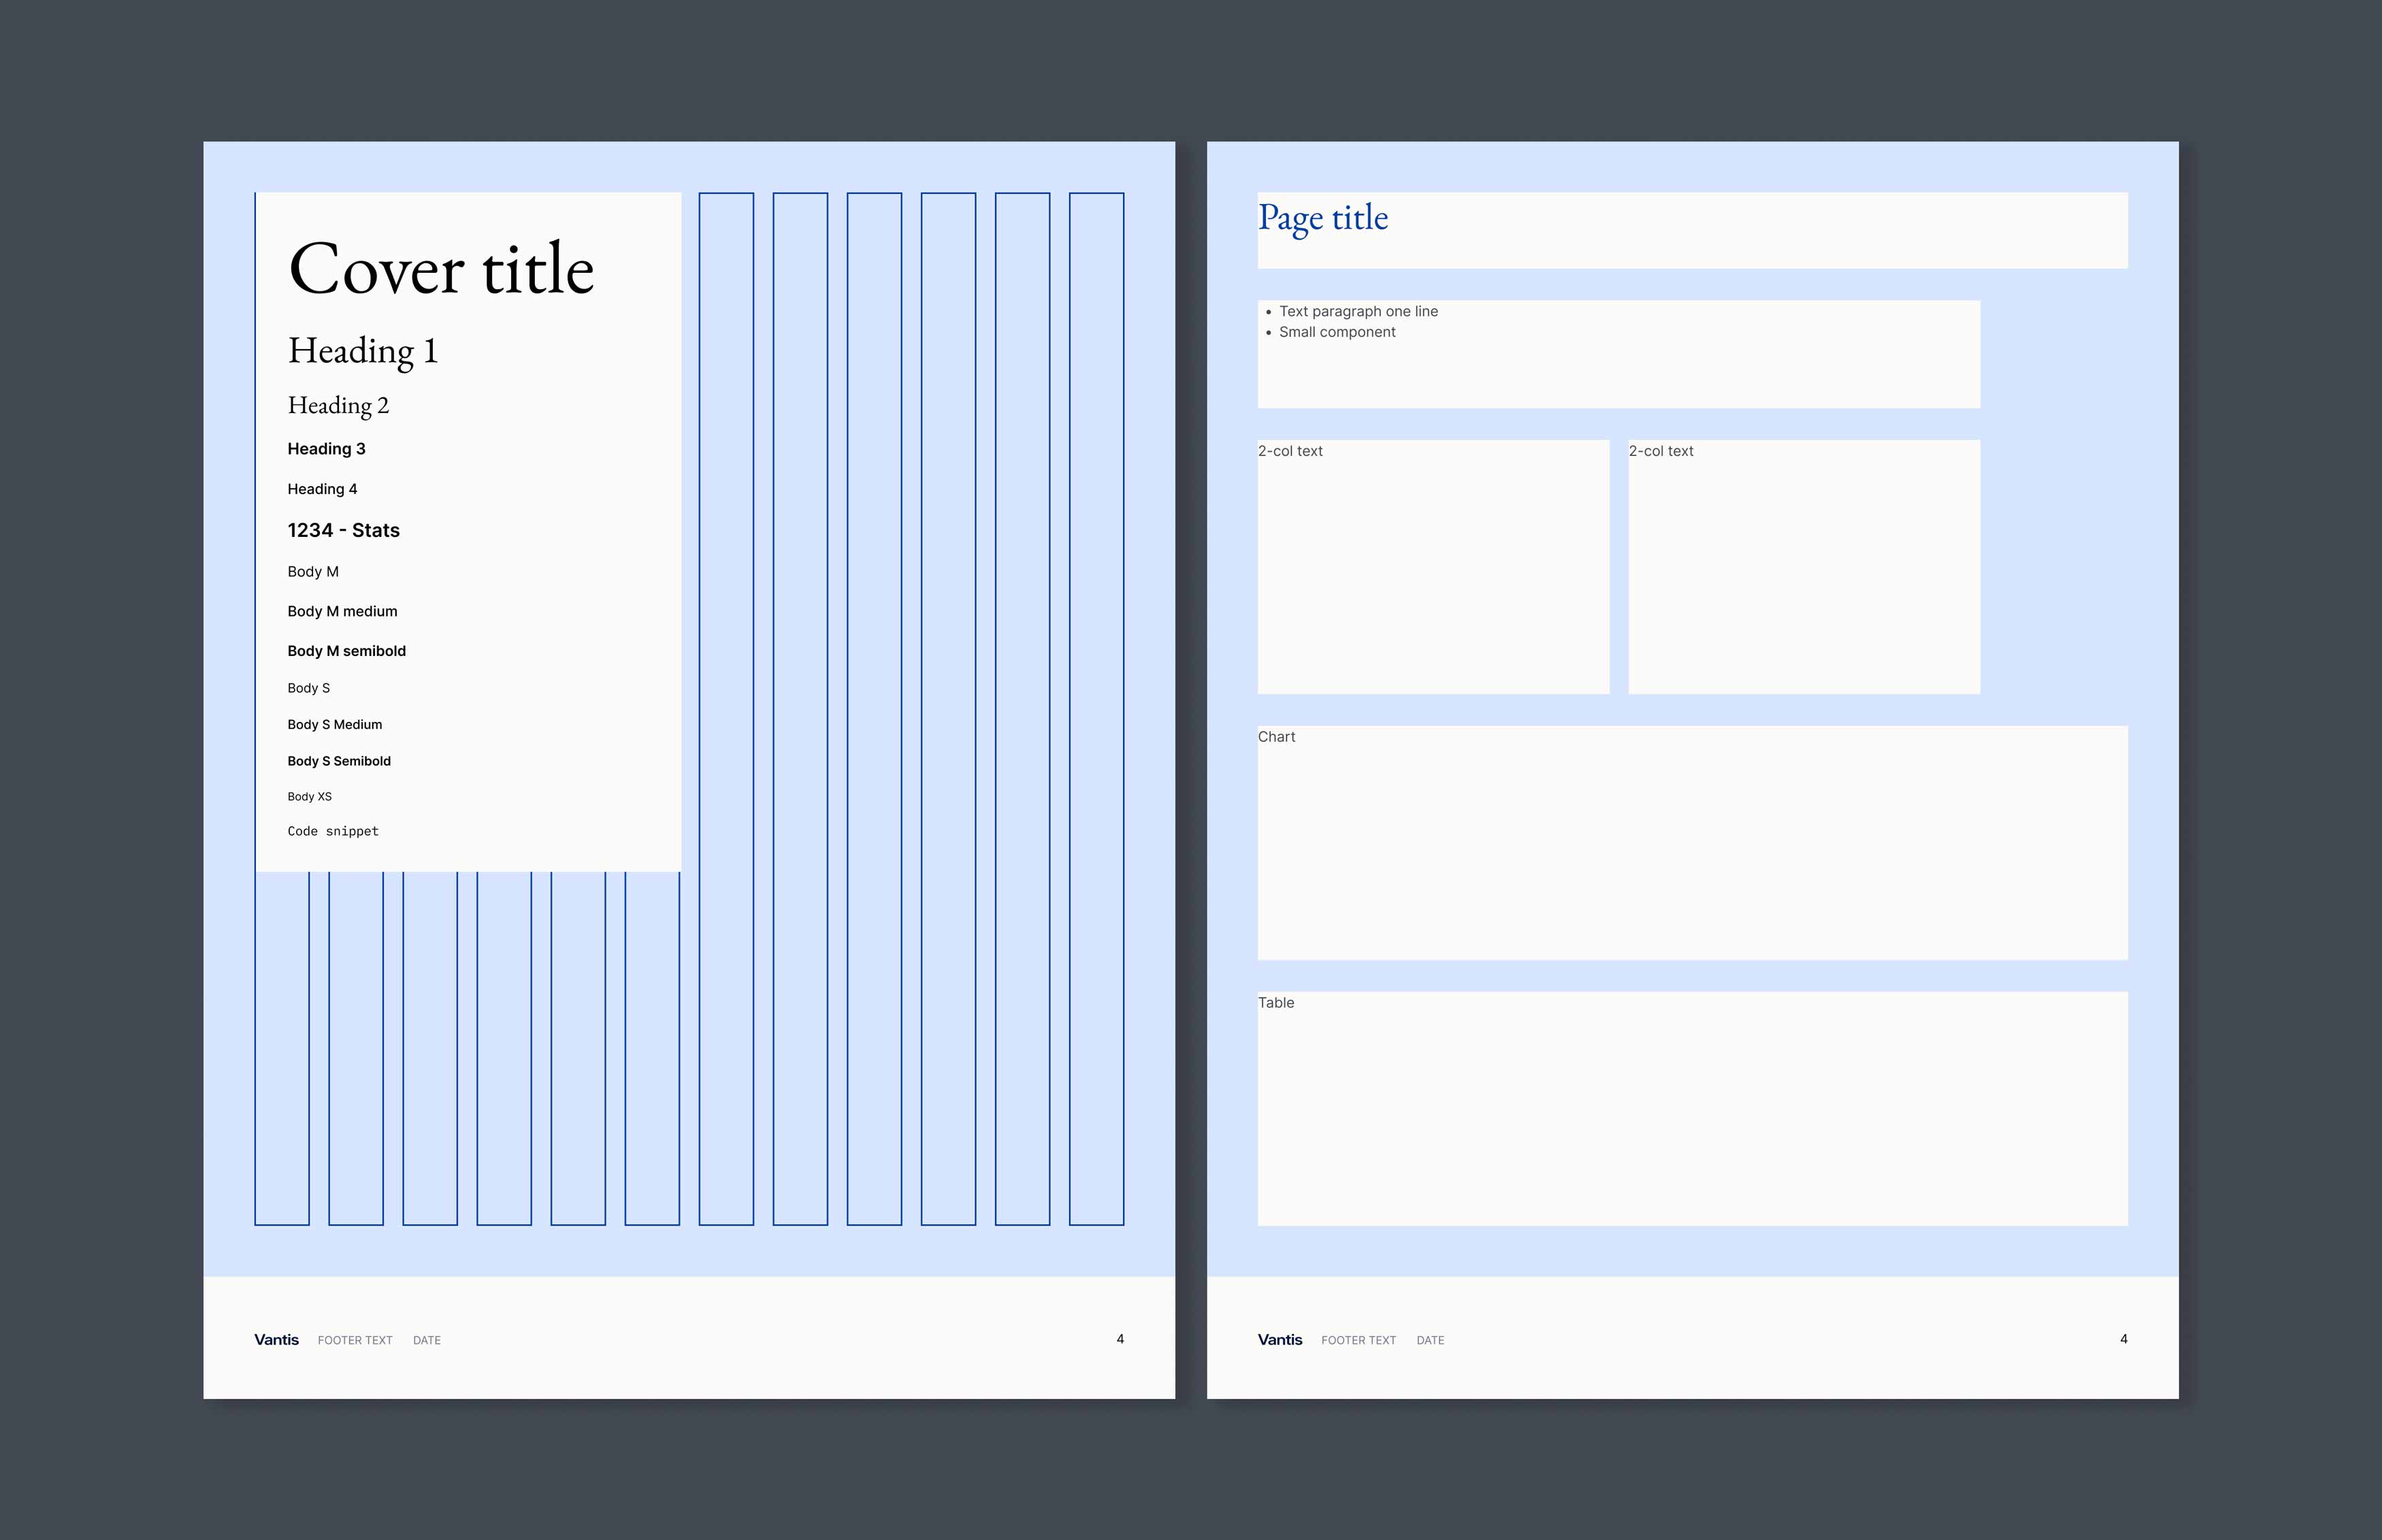
Page margin and layout rules
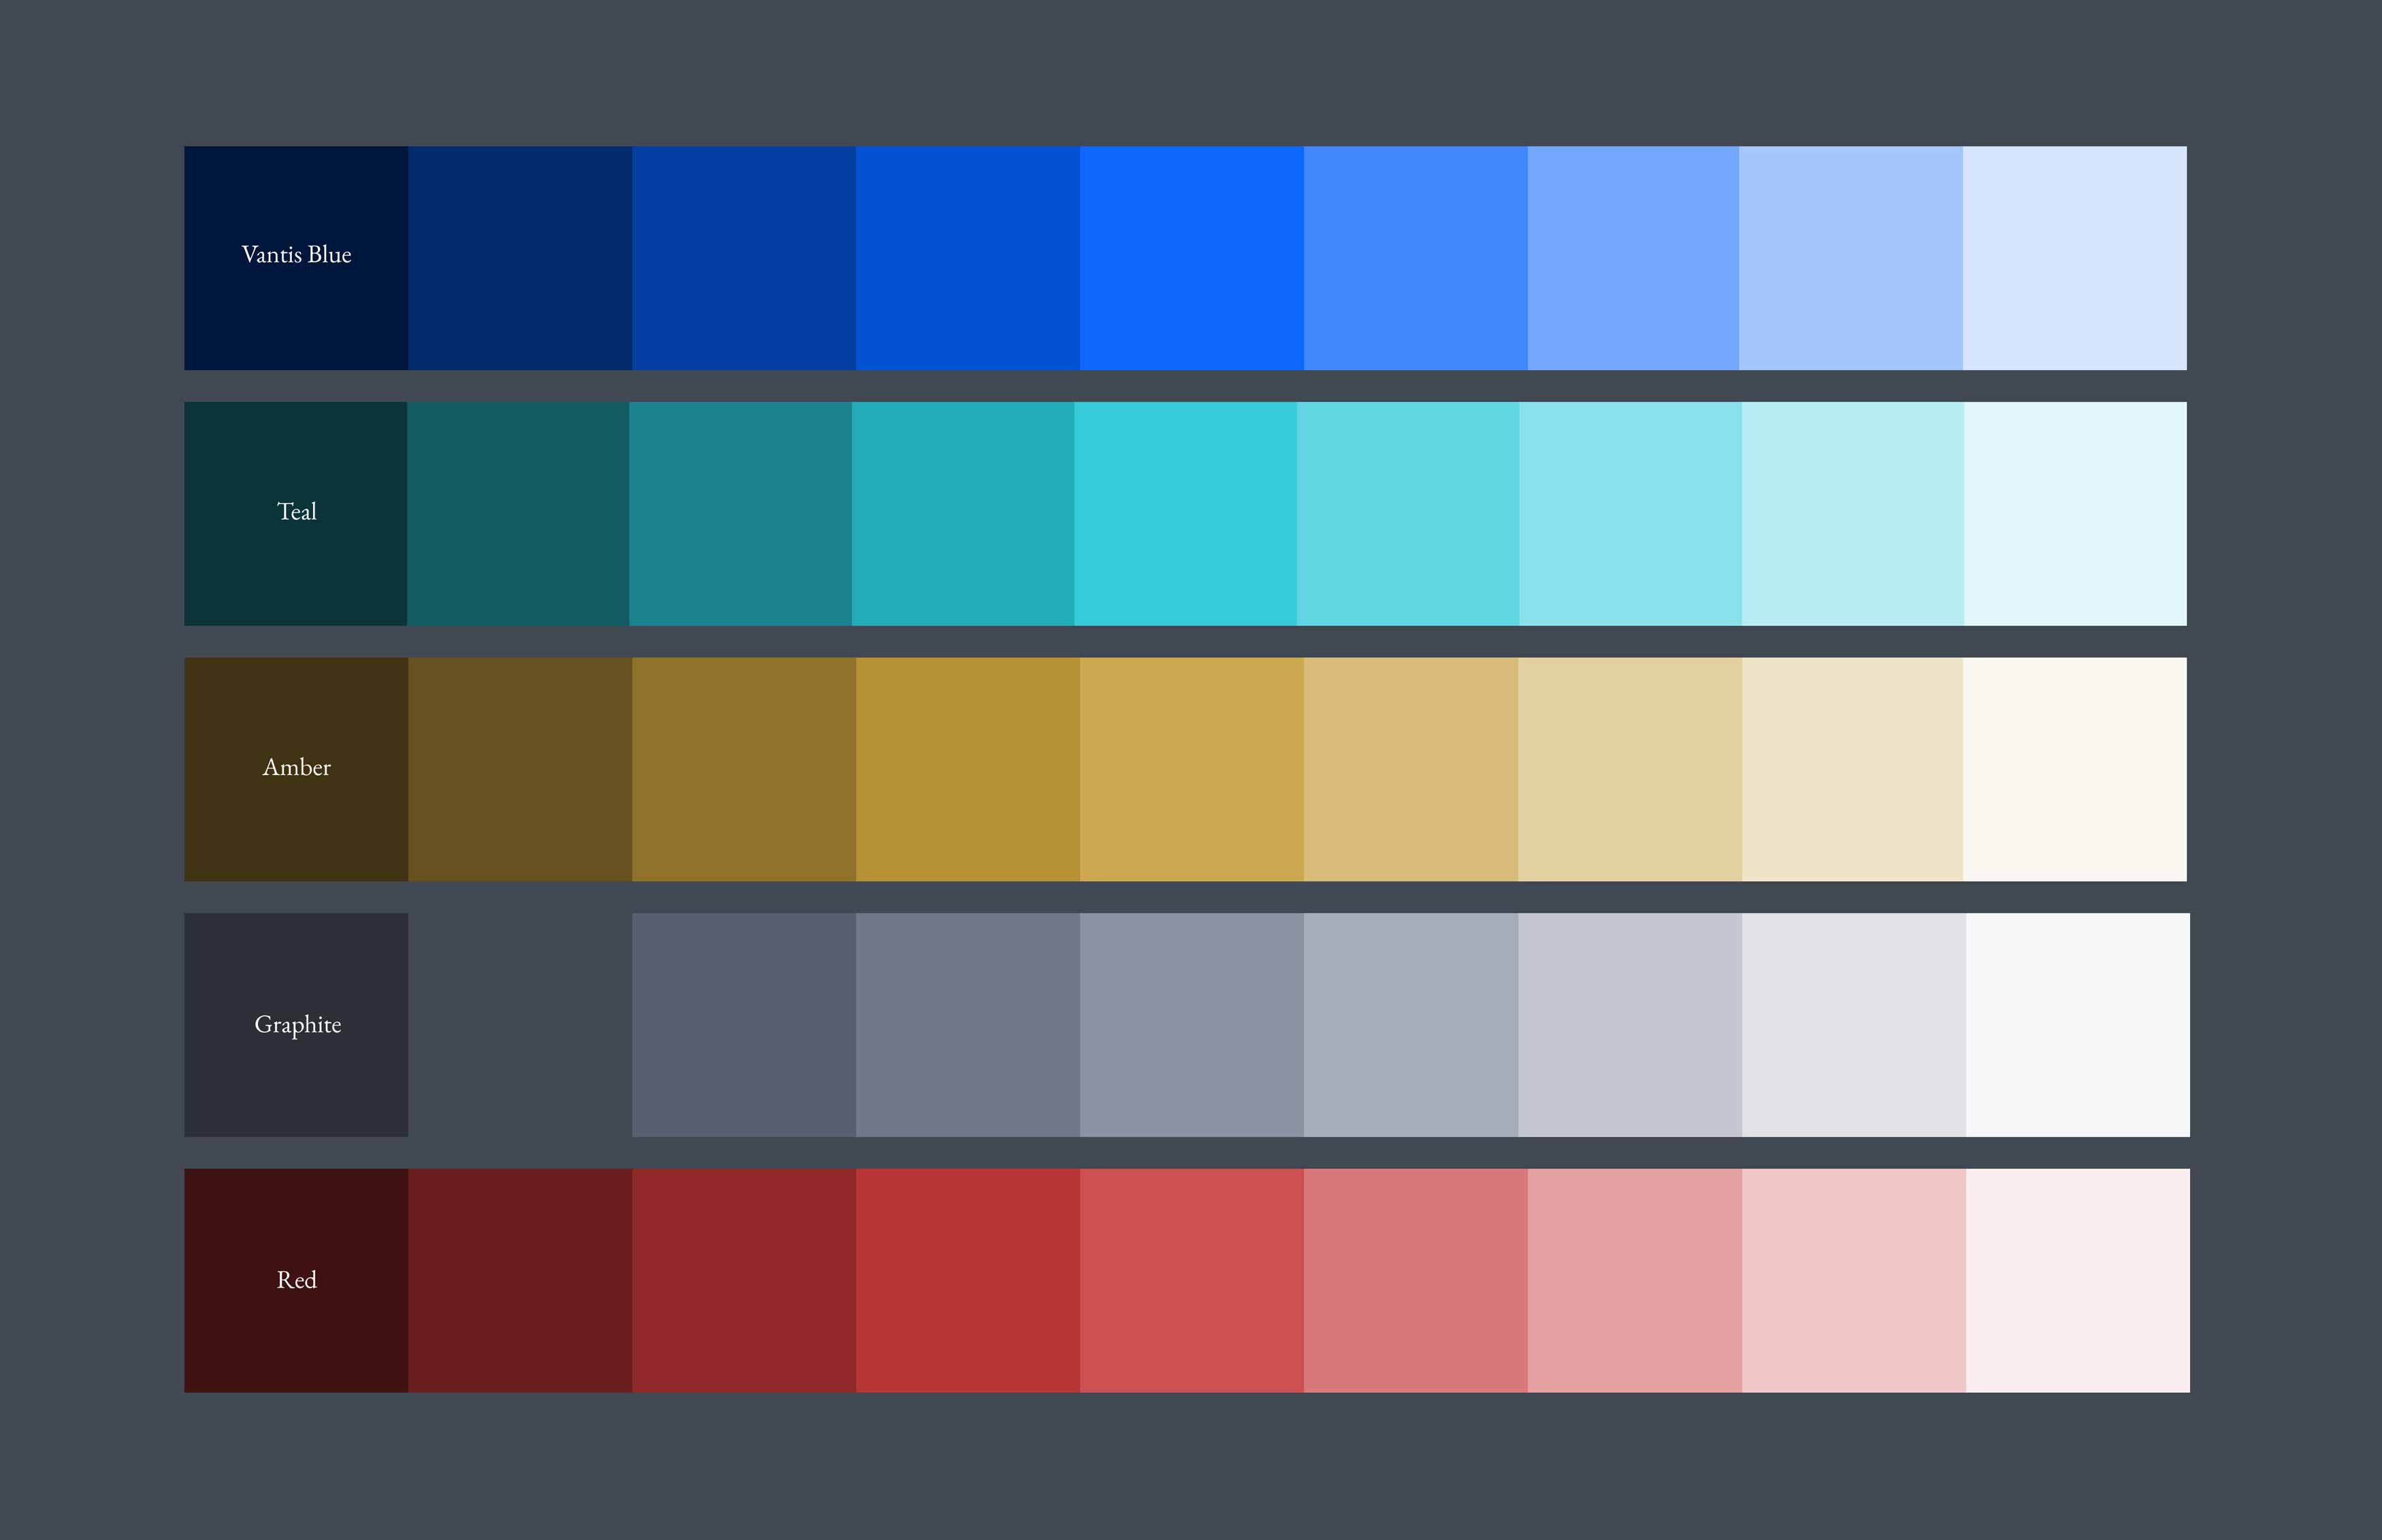
Color bars
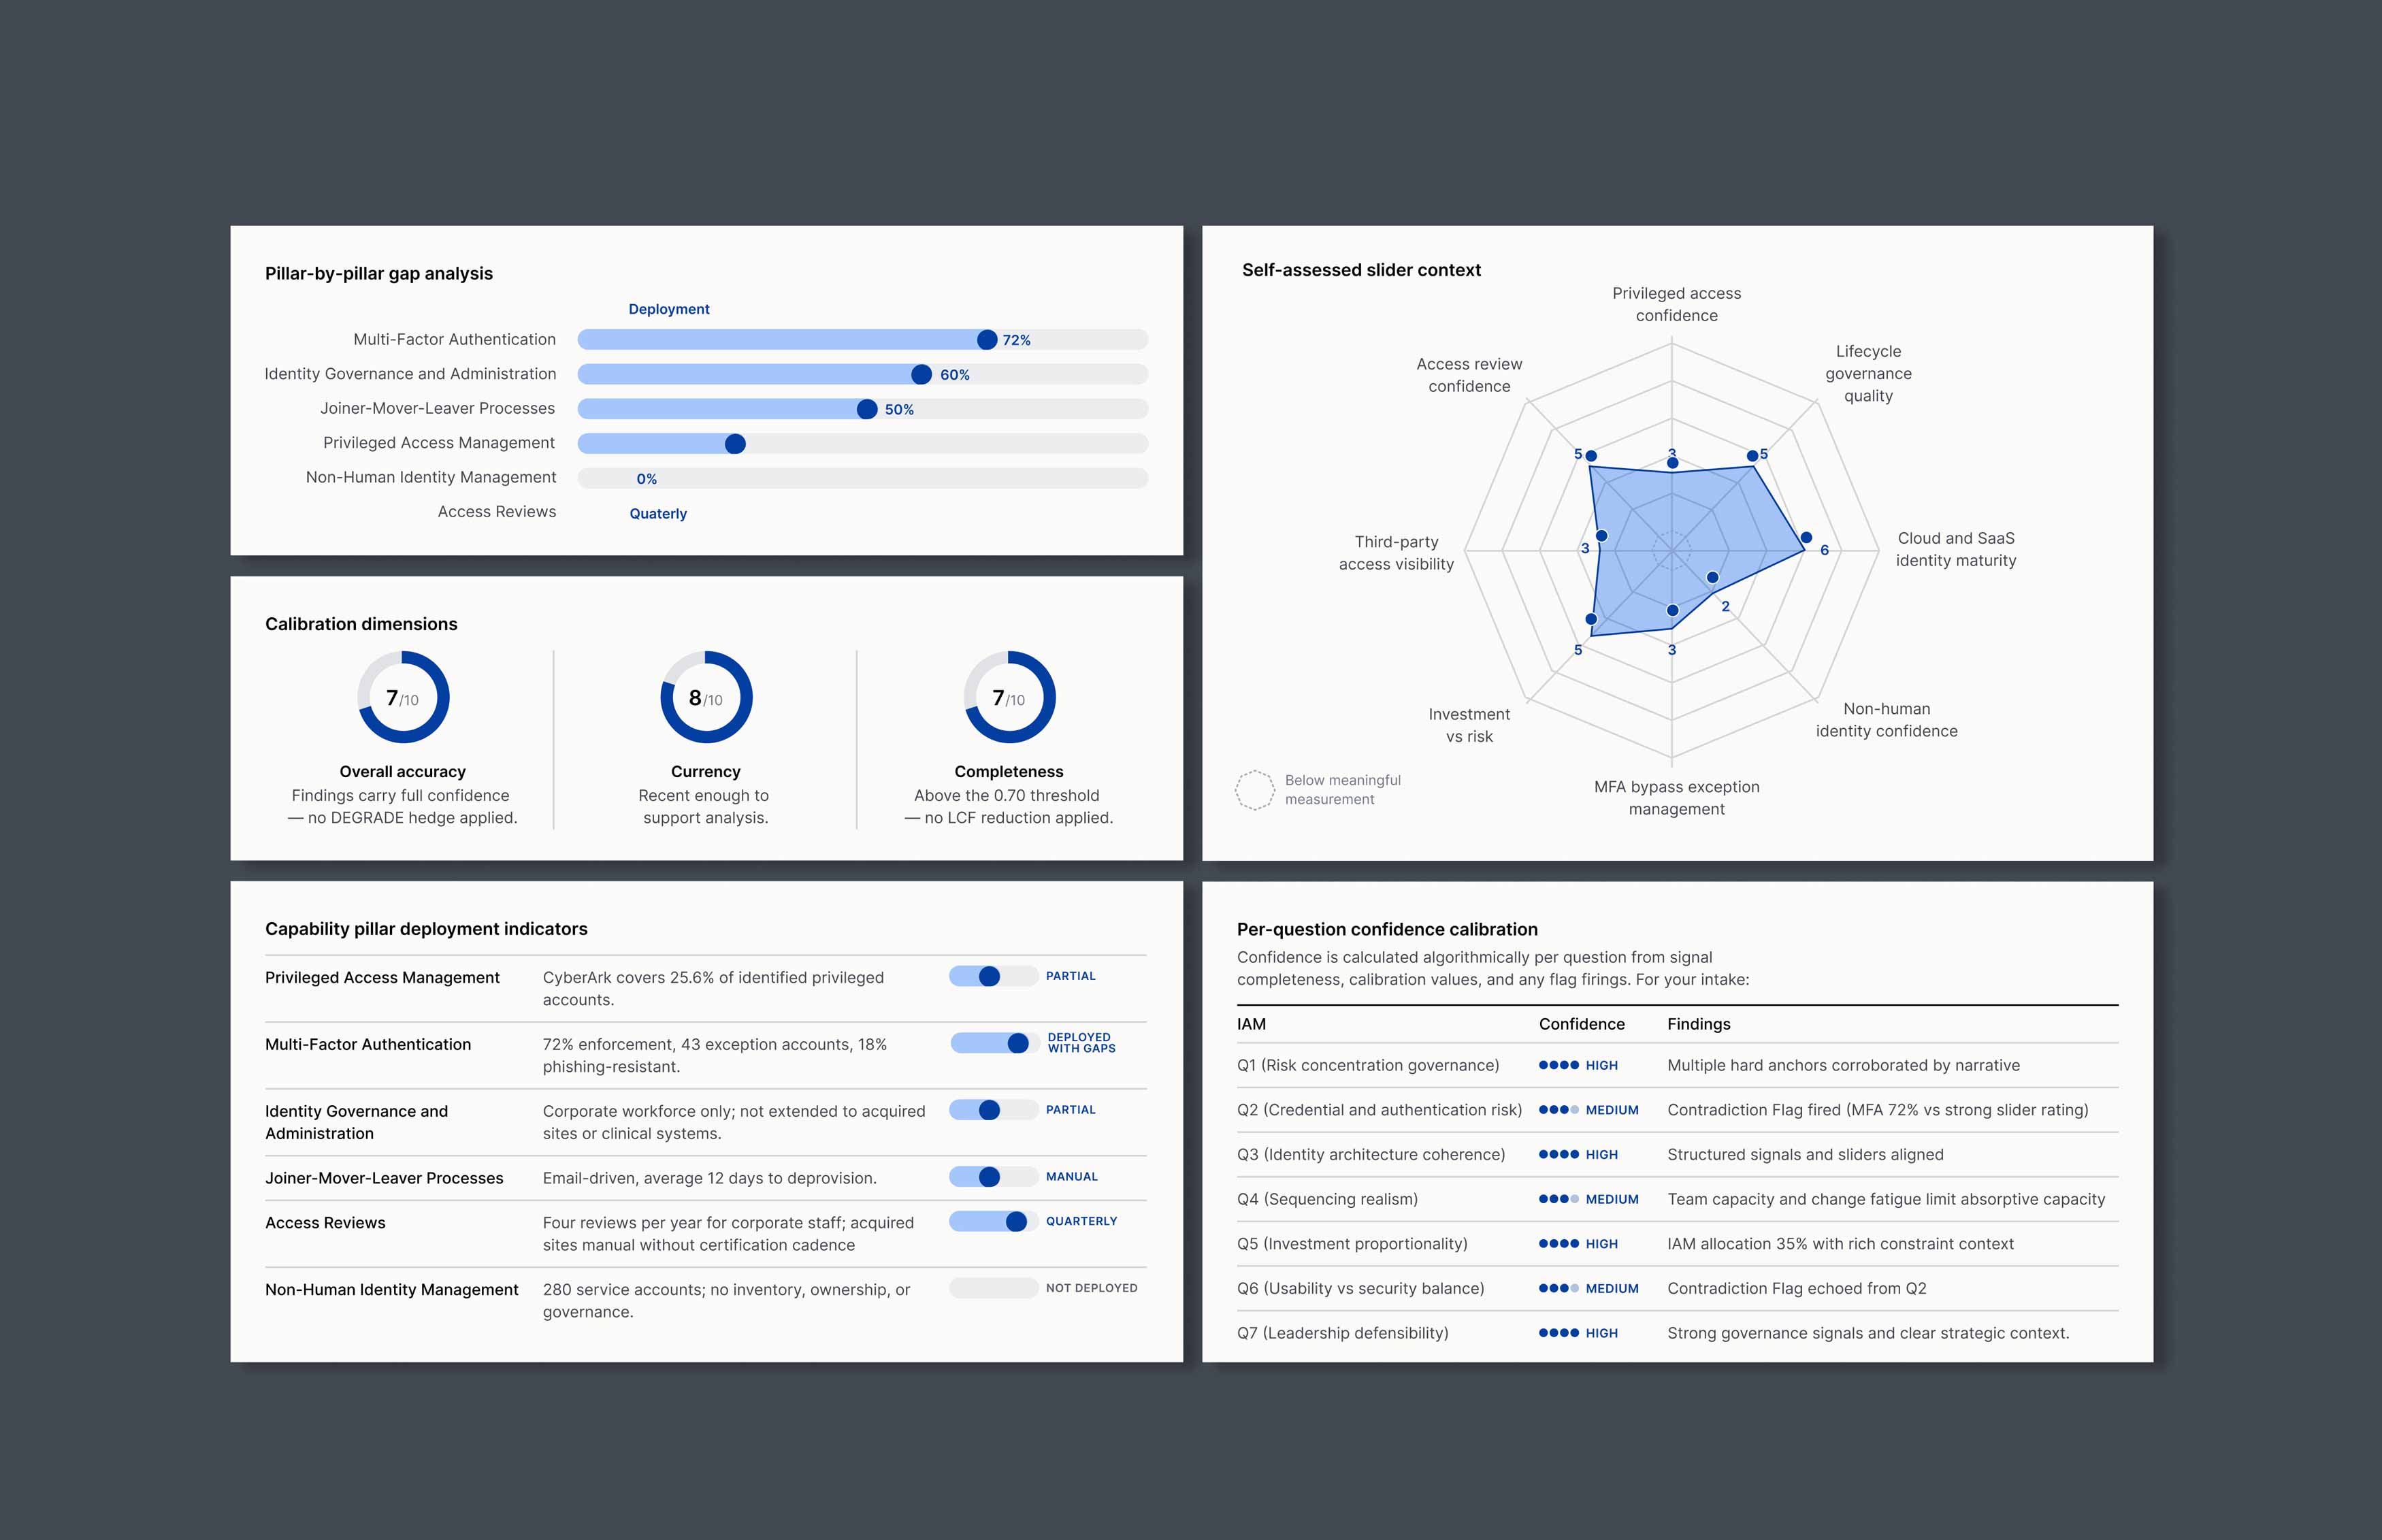
Chart components
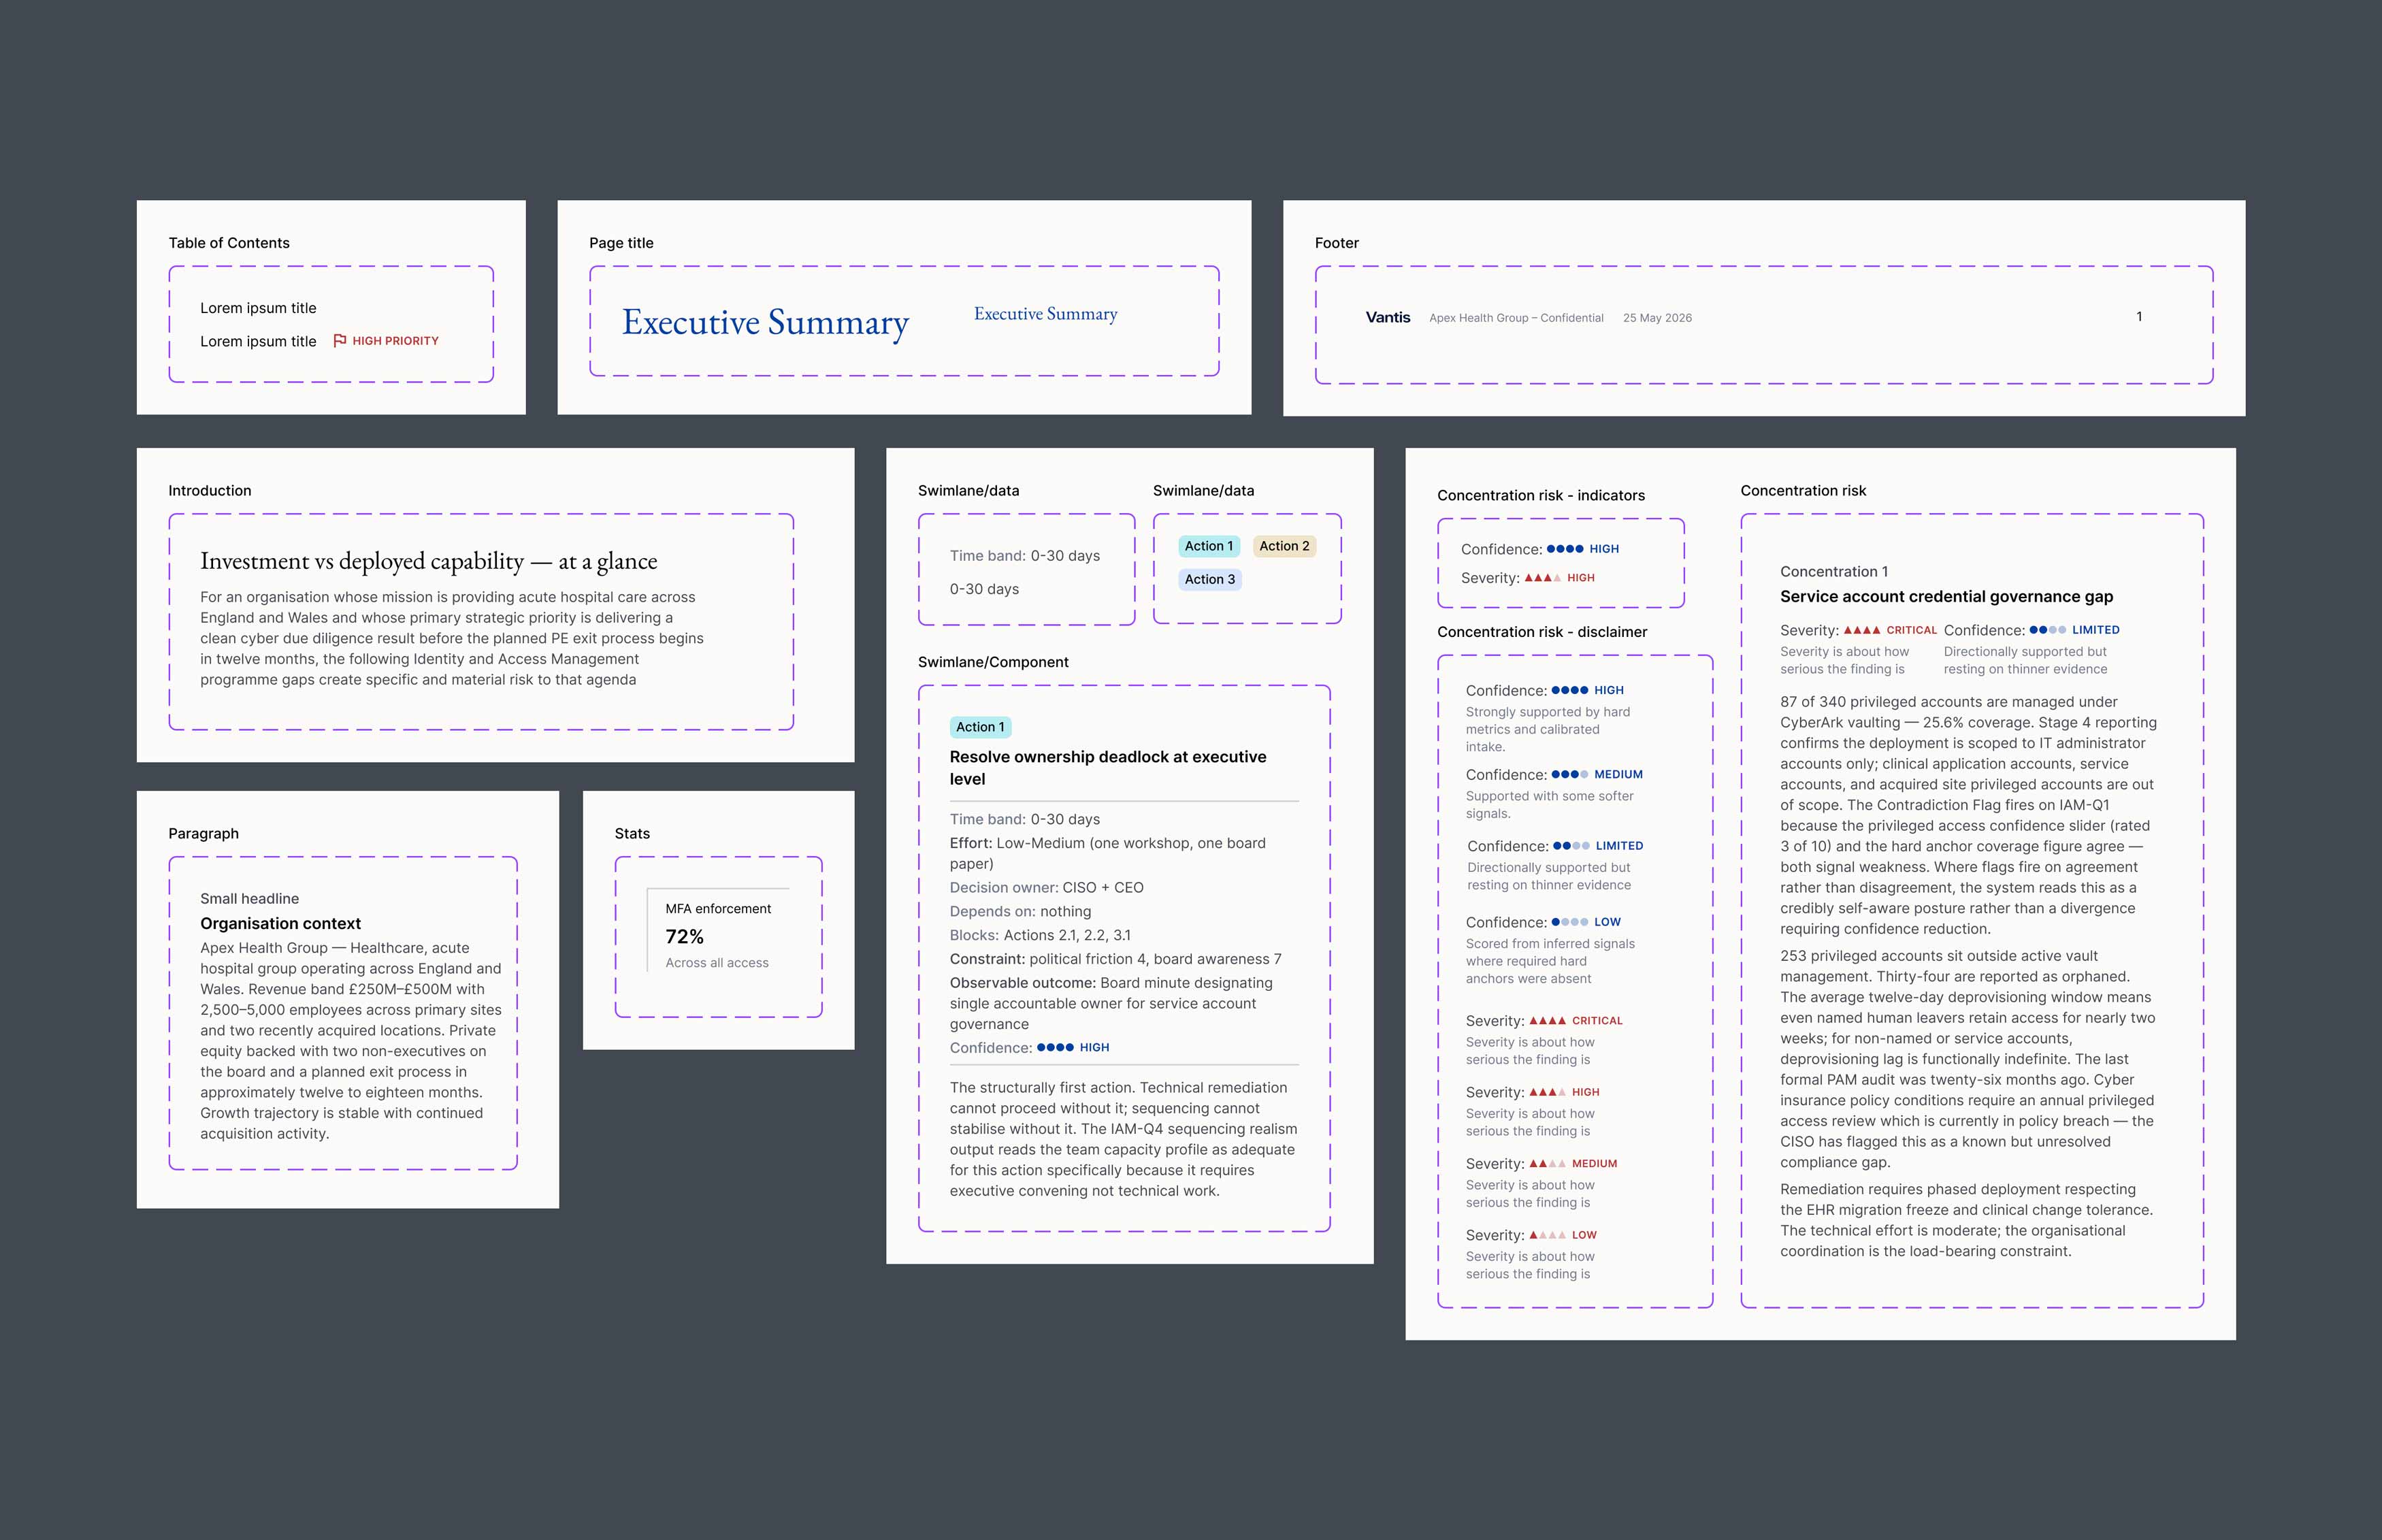
Text components and variants
Credits
Client: Vantis | Decision Intelligence
Design: Cinzia Bongino
Development: ProCoders
Year
2026